3.5. Data Structure
Introduction to data in Grasshopper.
Data Trees extended:
Download example file for Data Trees (extended):
GH FileData Structure in GH
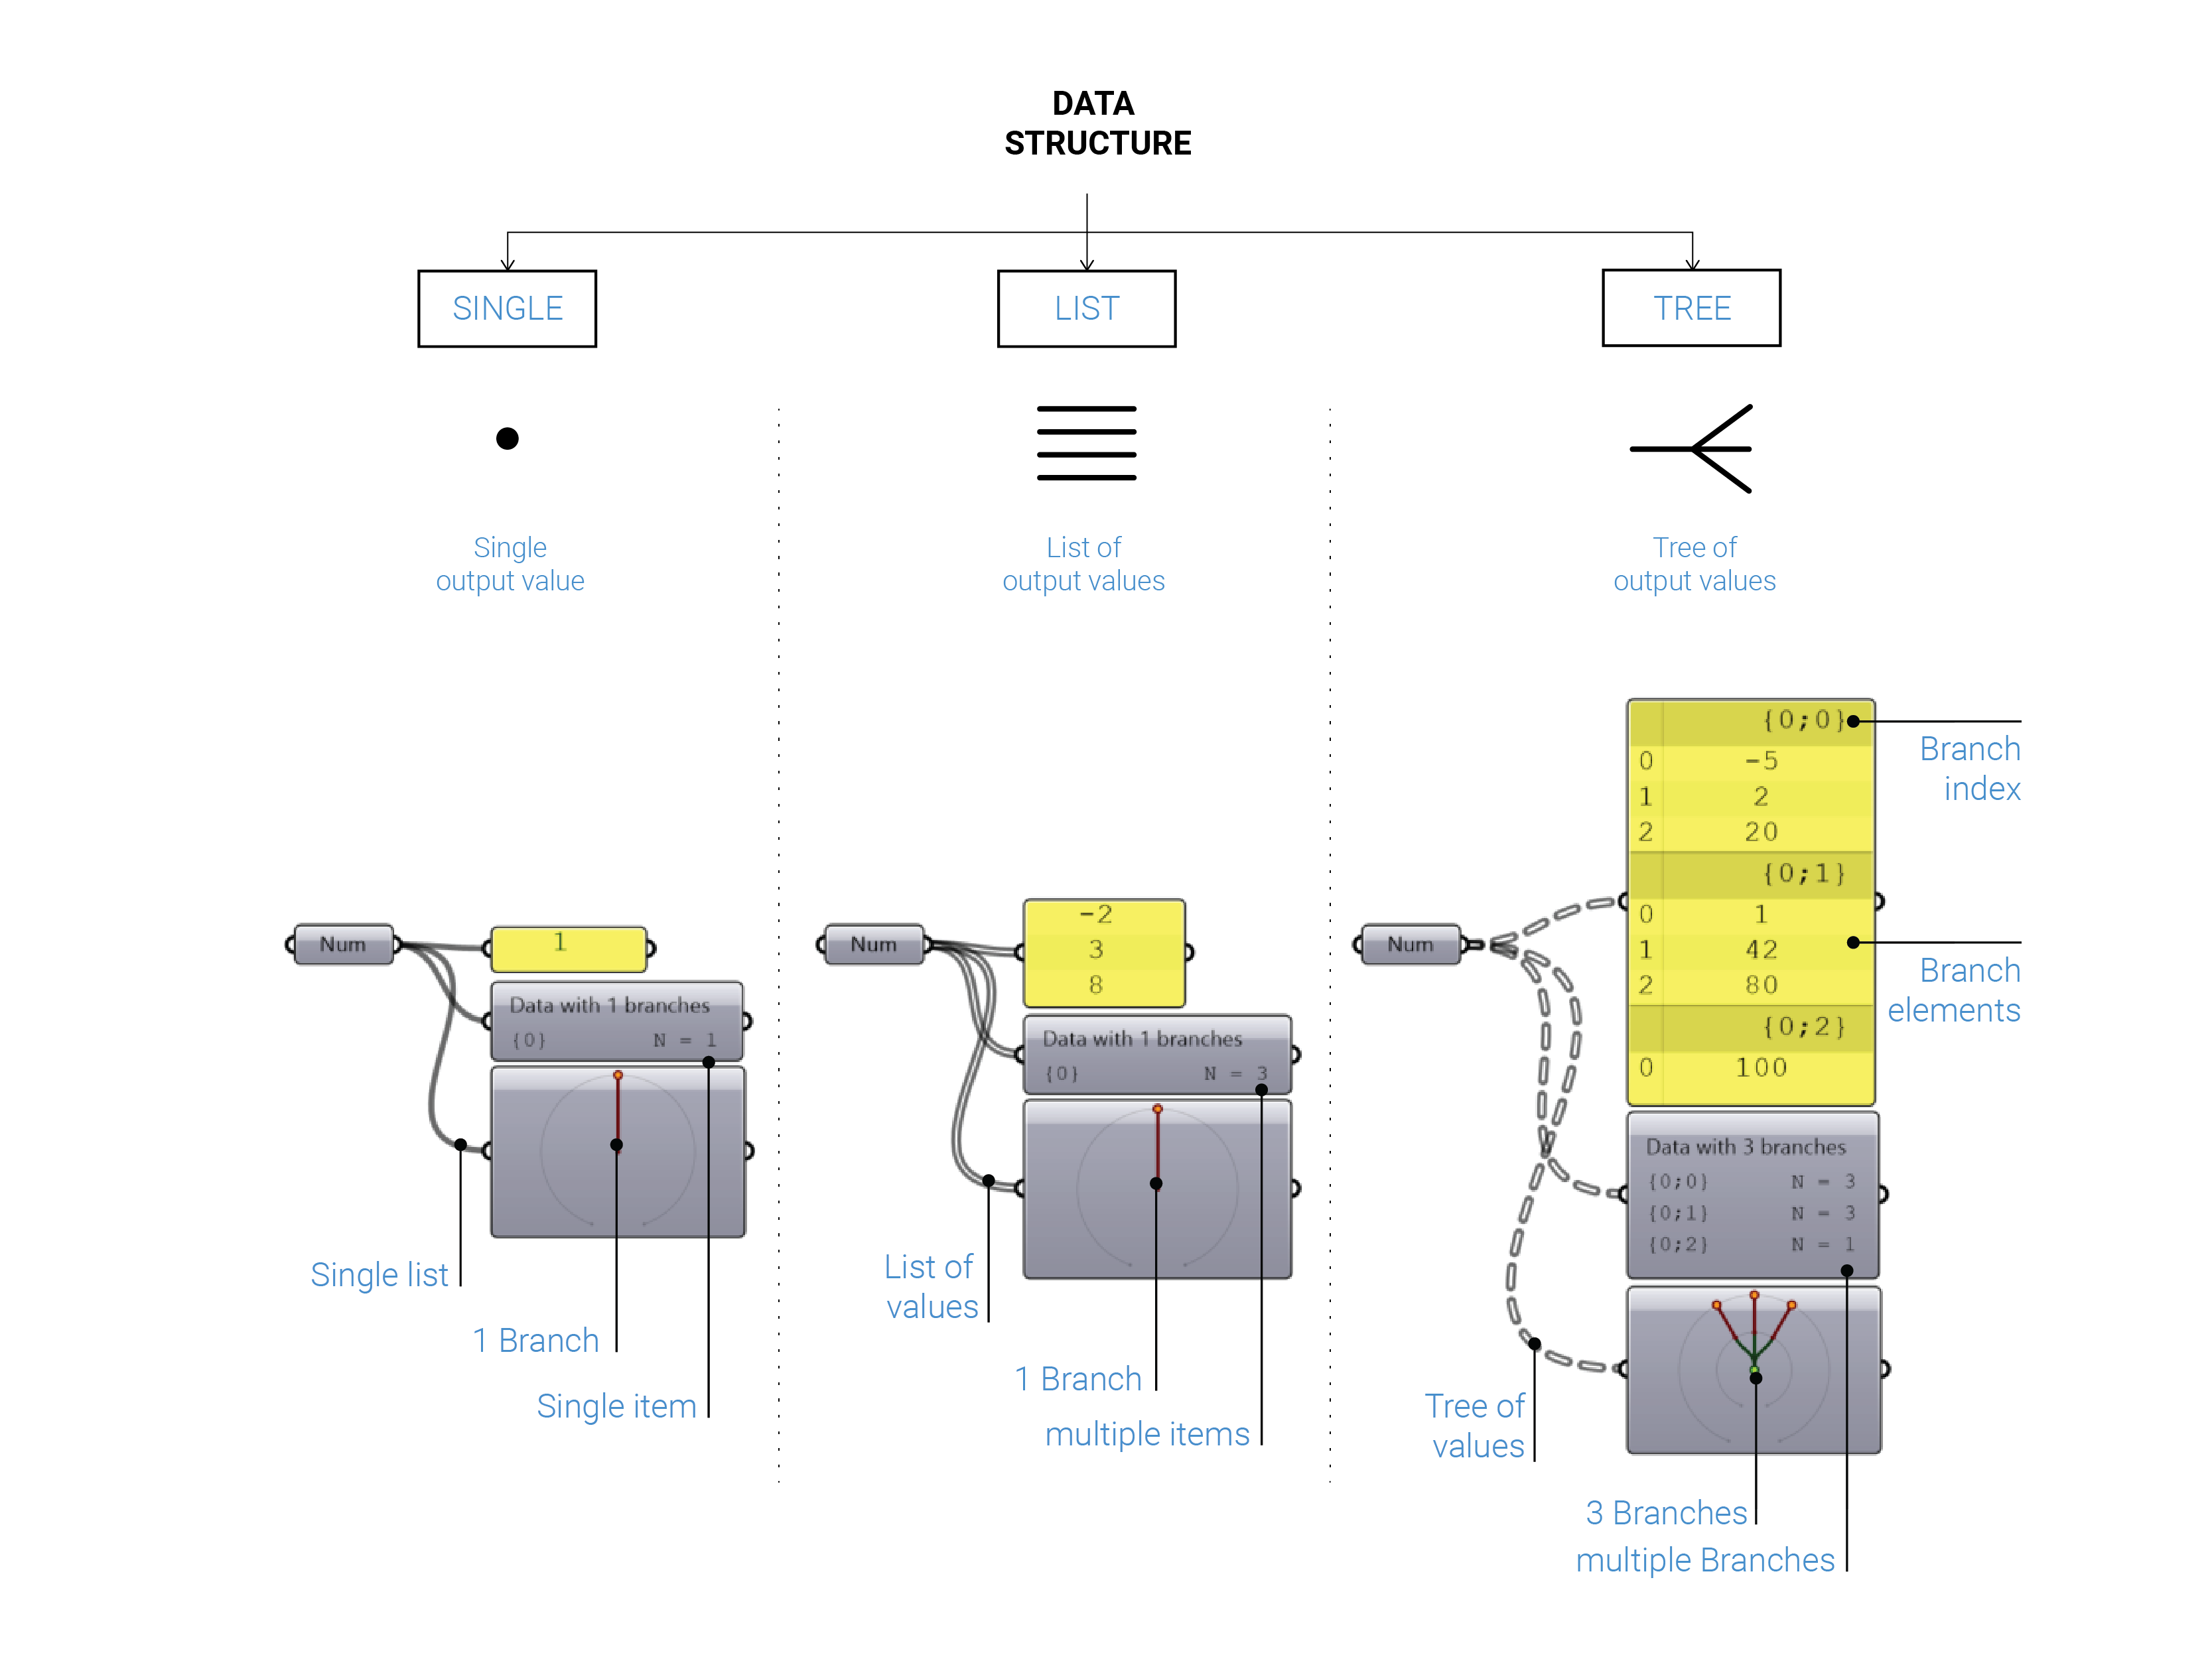
We can subdivide data structures into 3 different groups in GH:
- Single
- List
- Tree
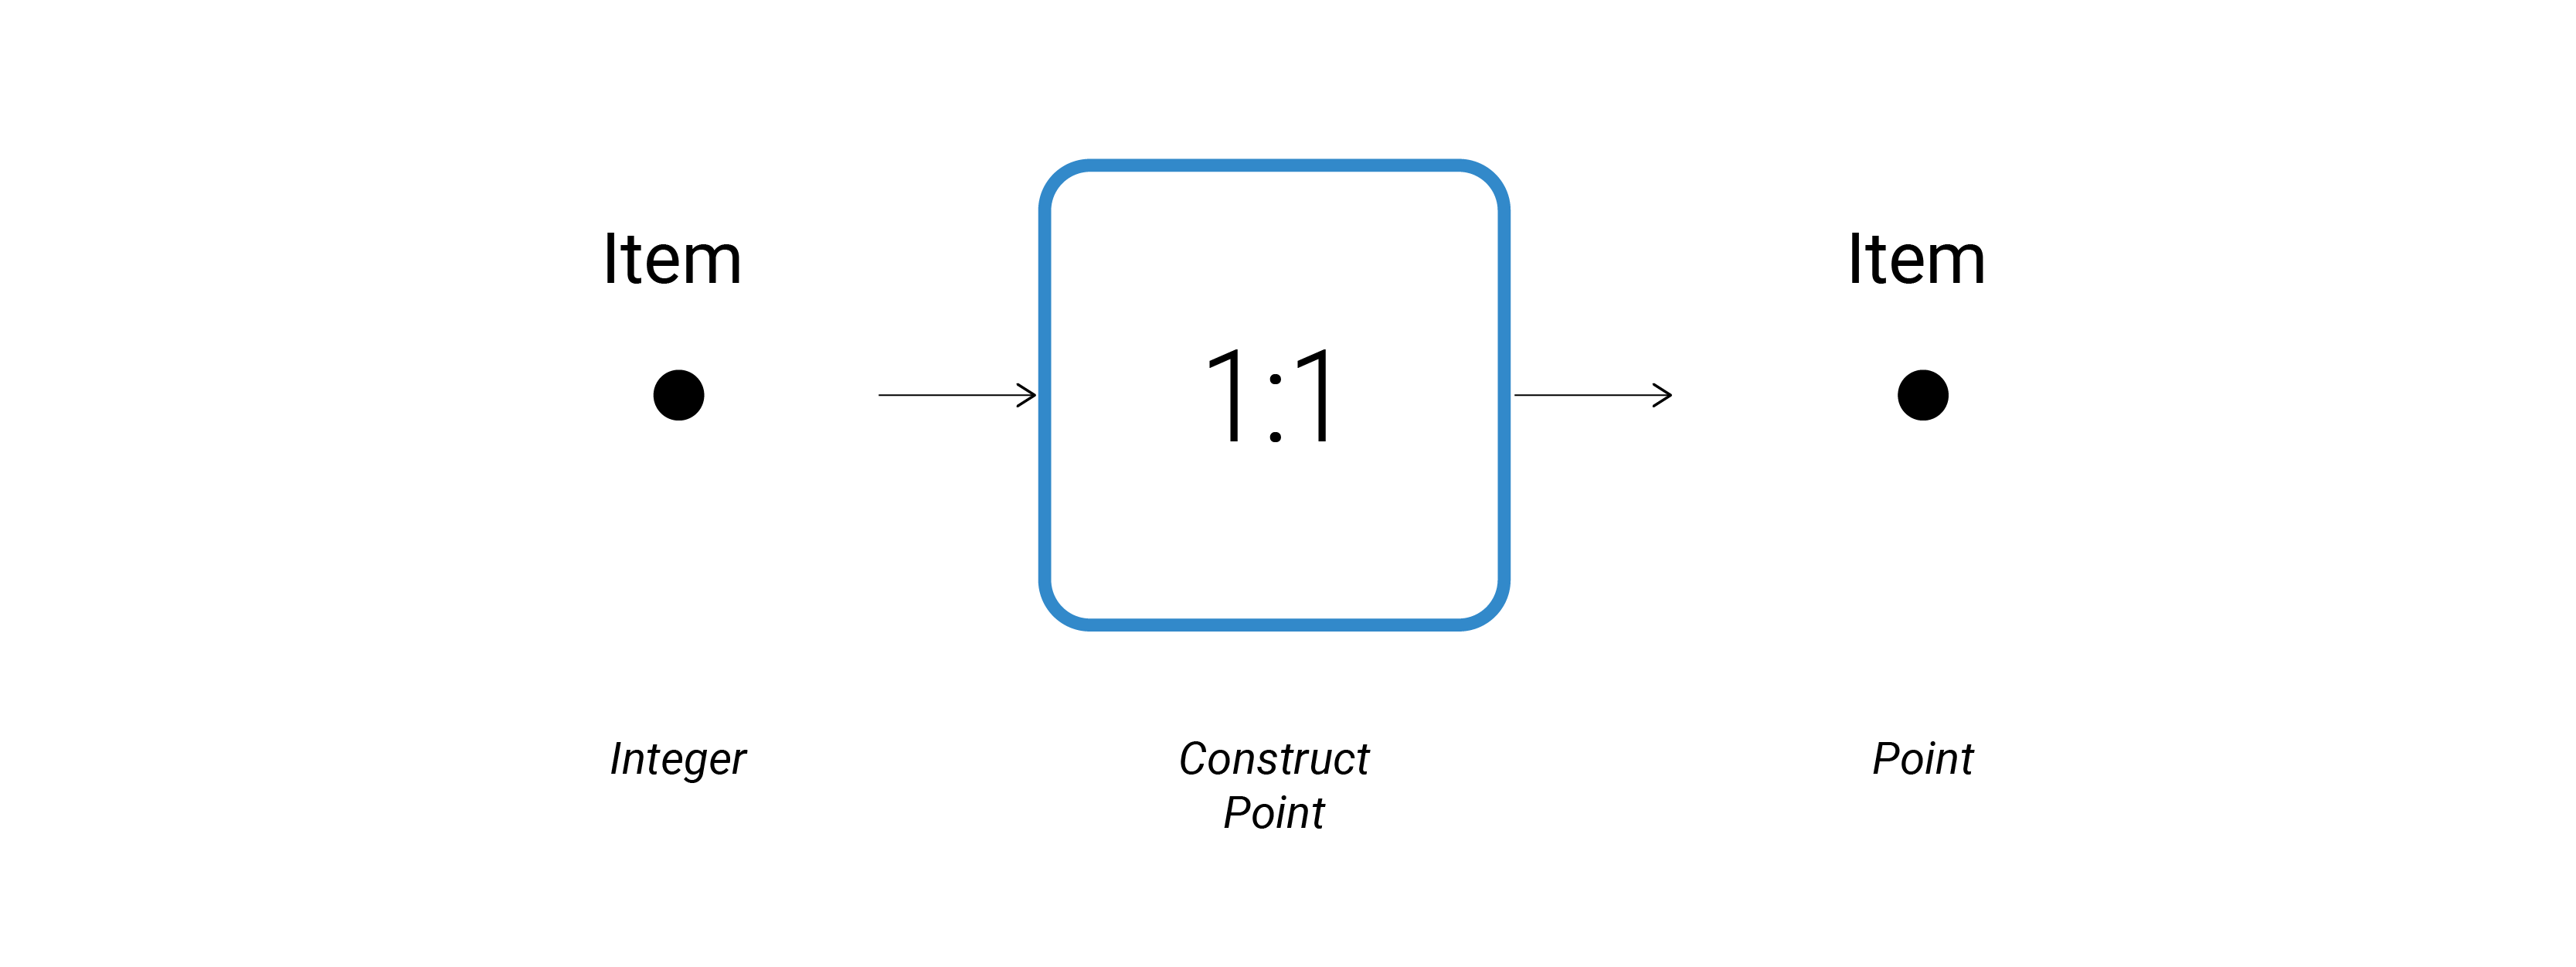
Single level operations
Many components operates on individual values and also output individual values as result:
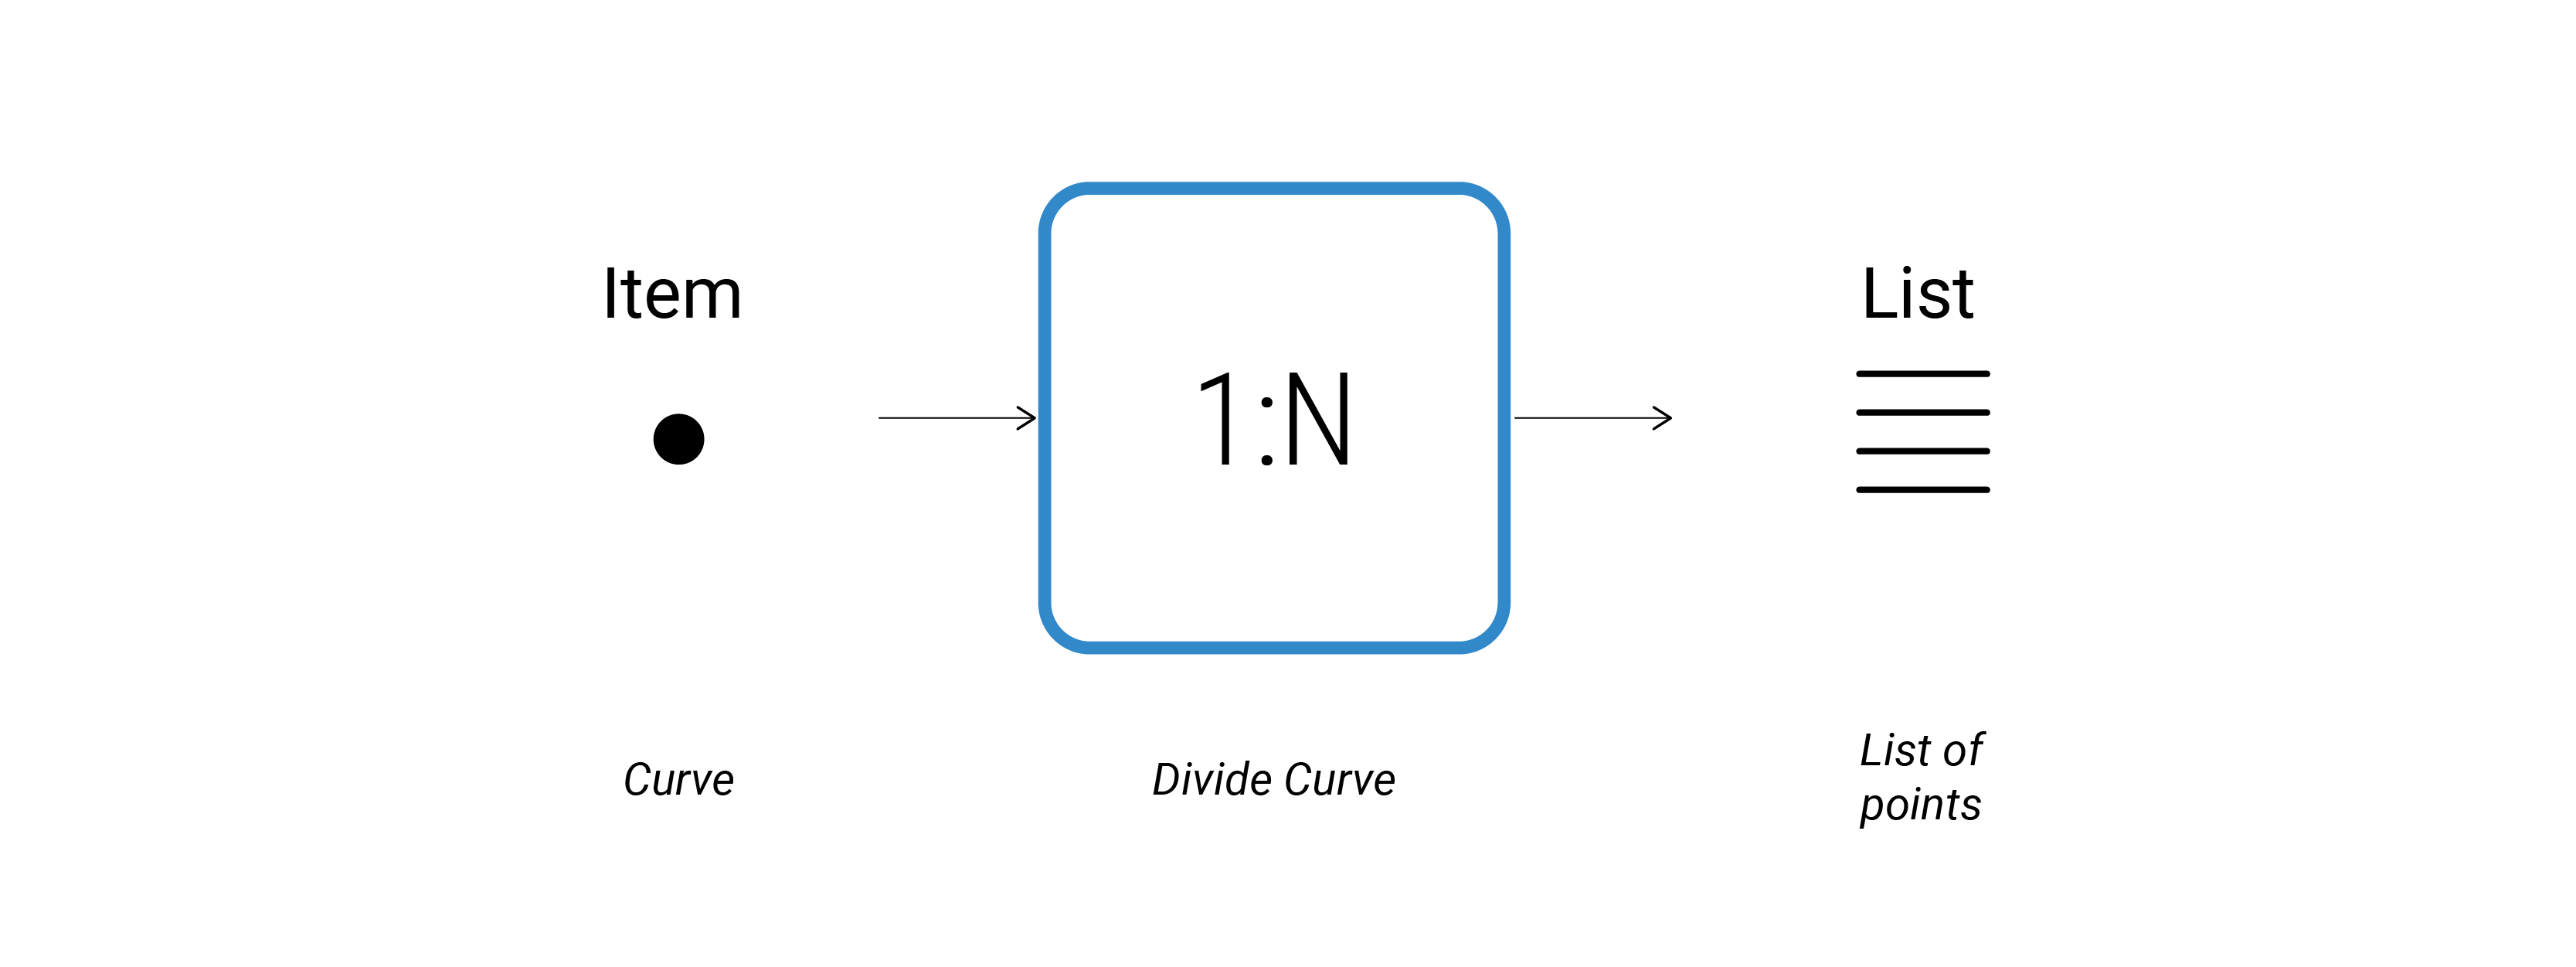
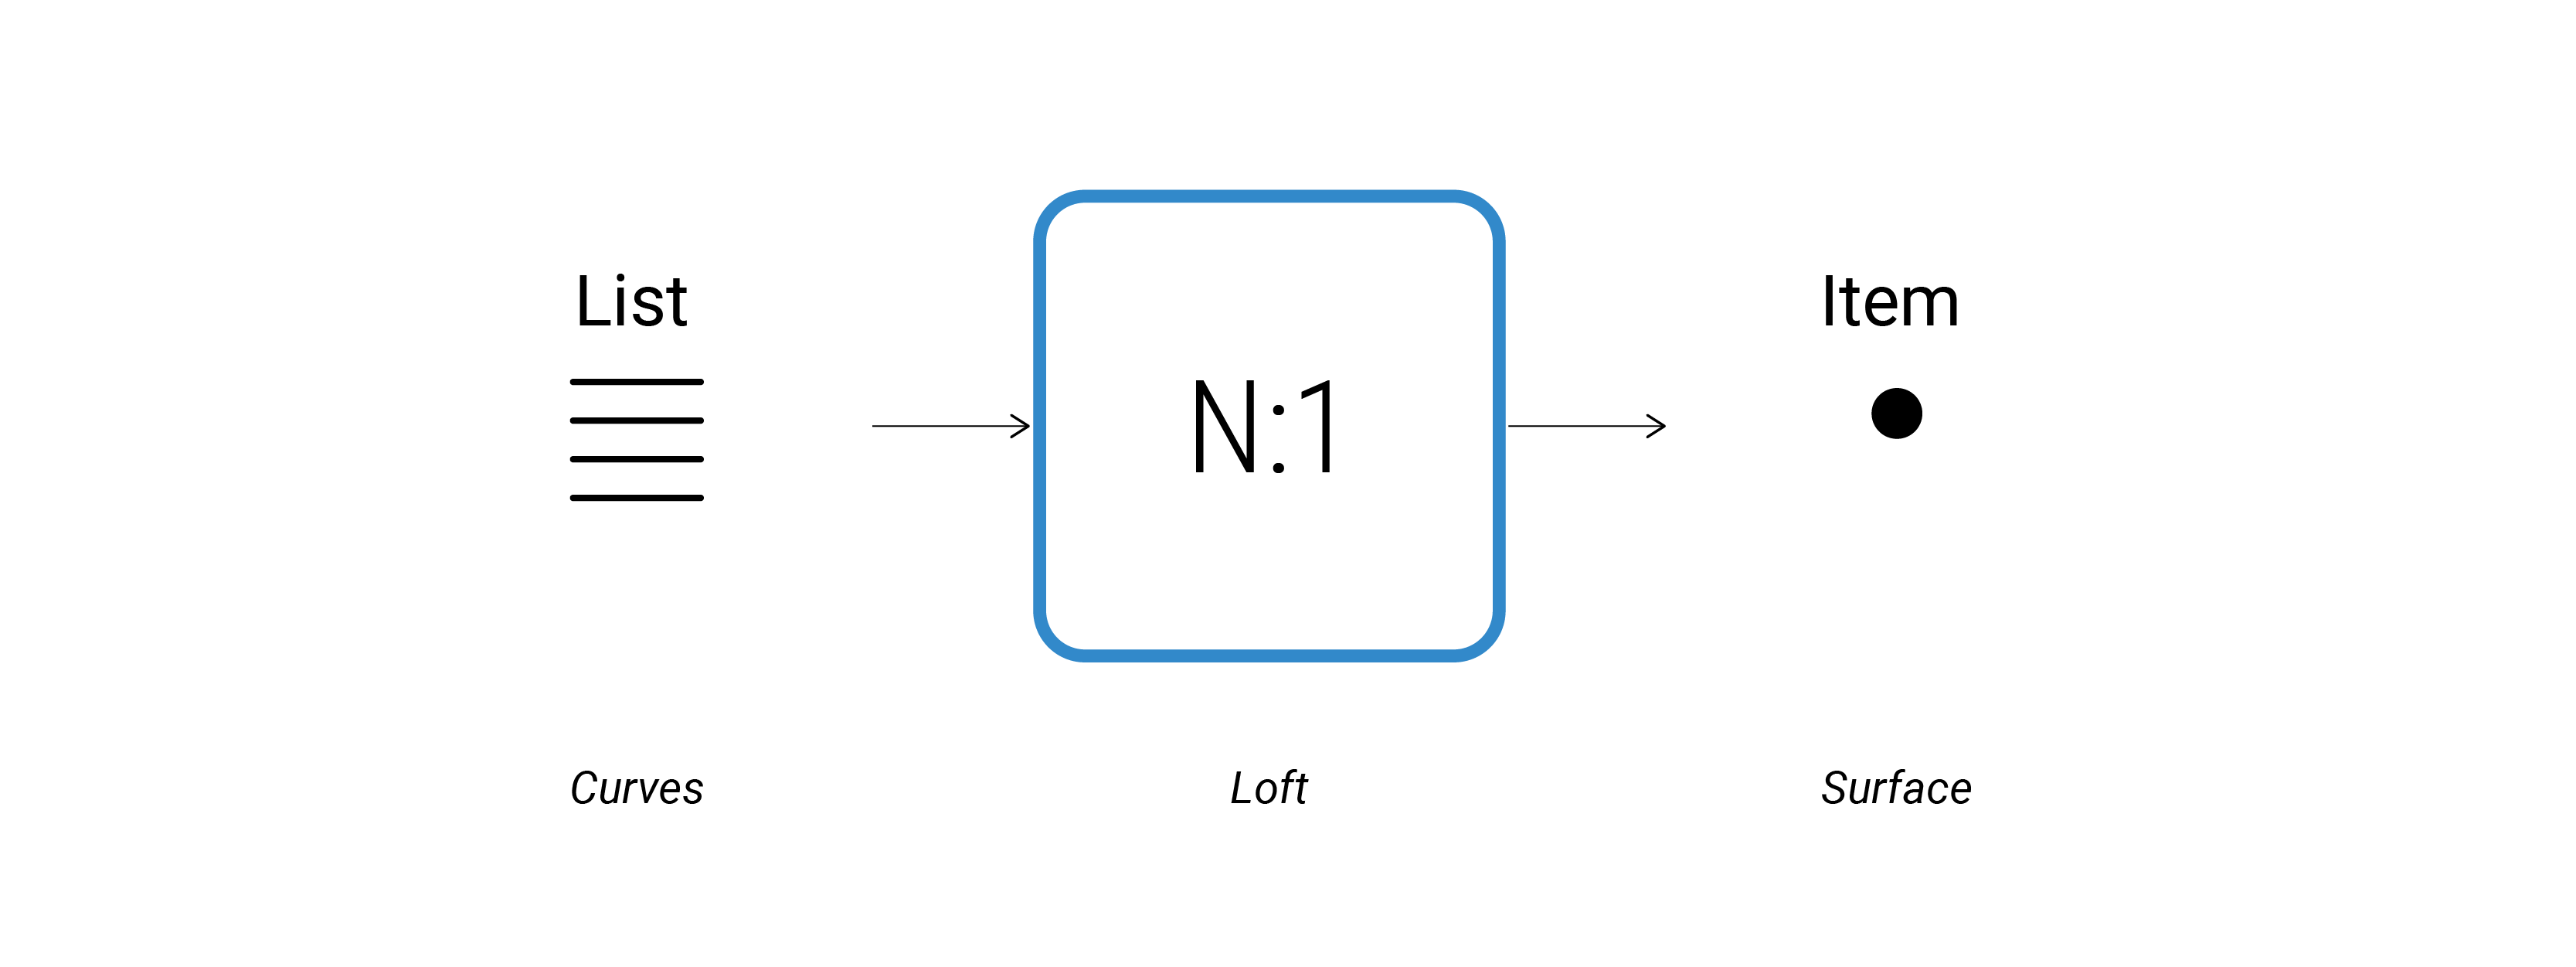
Lists level operations
Other category of components create lists of data from single input values:
 Occurring also the opposite behavior:
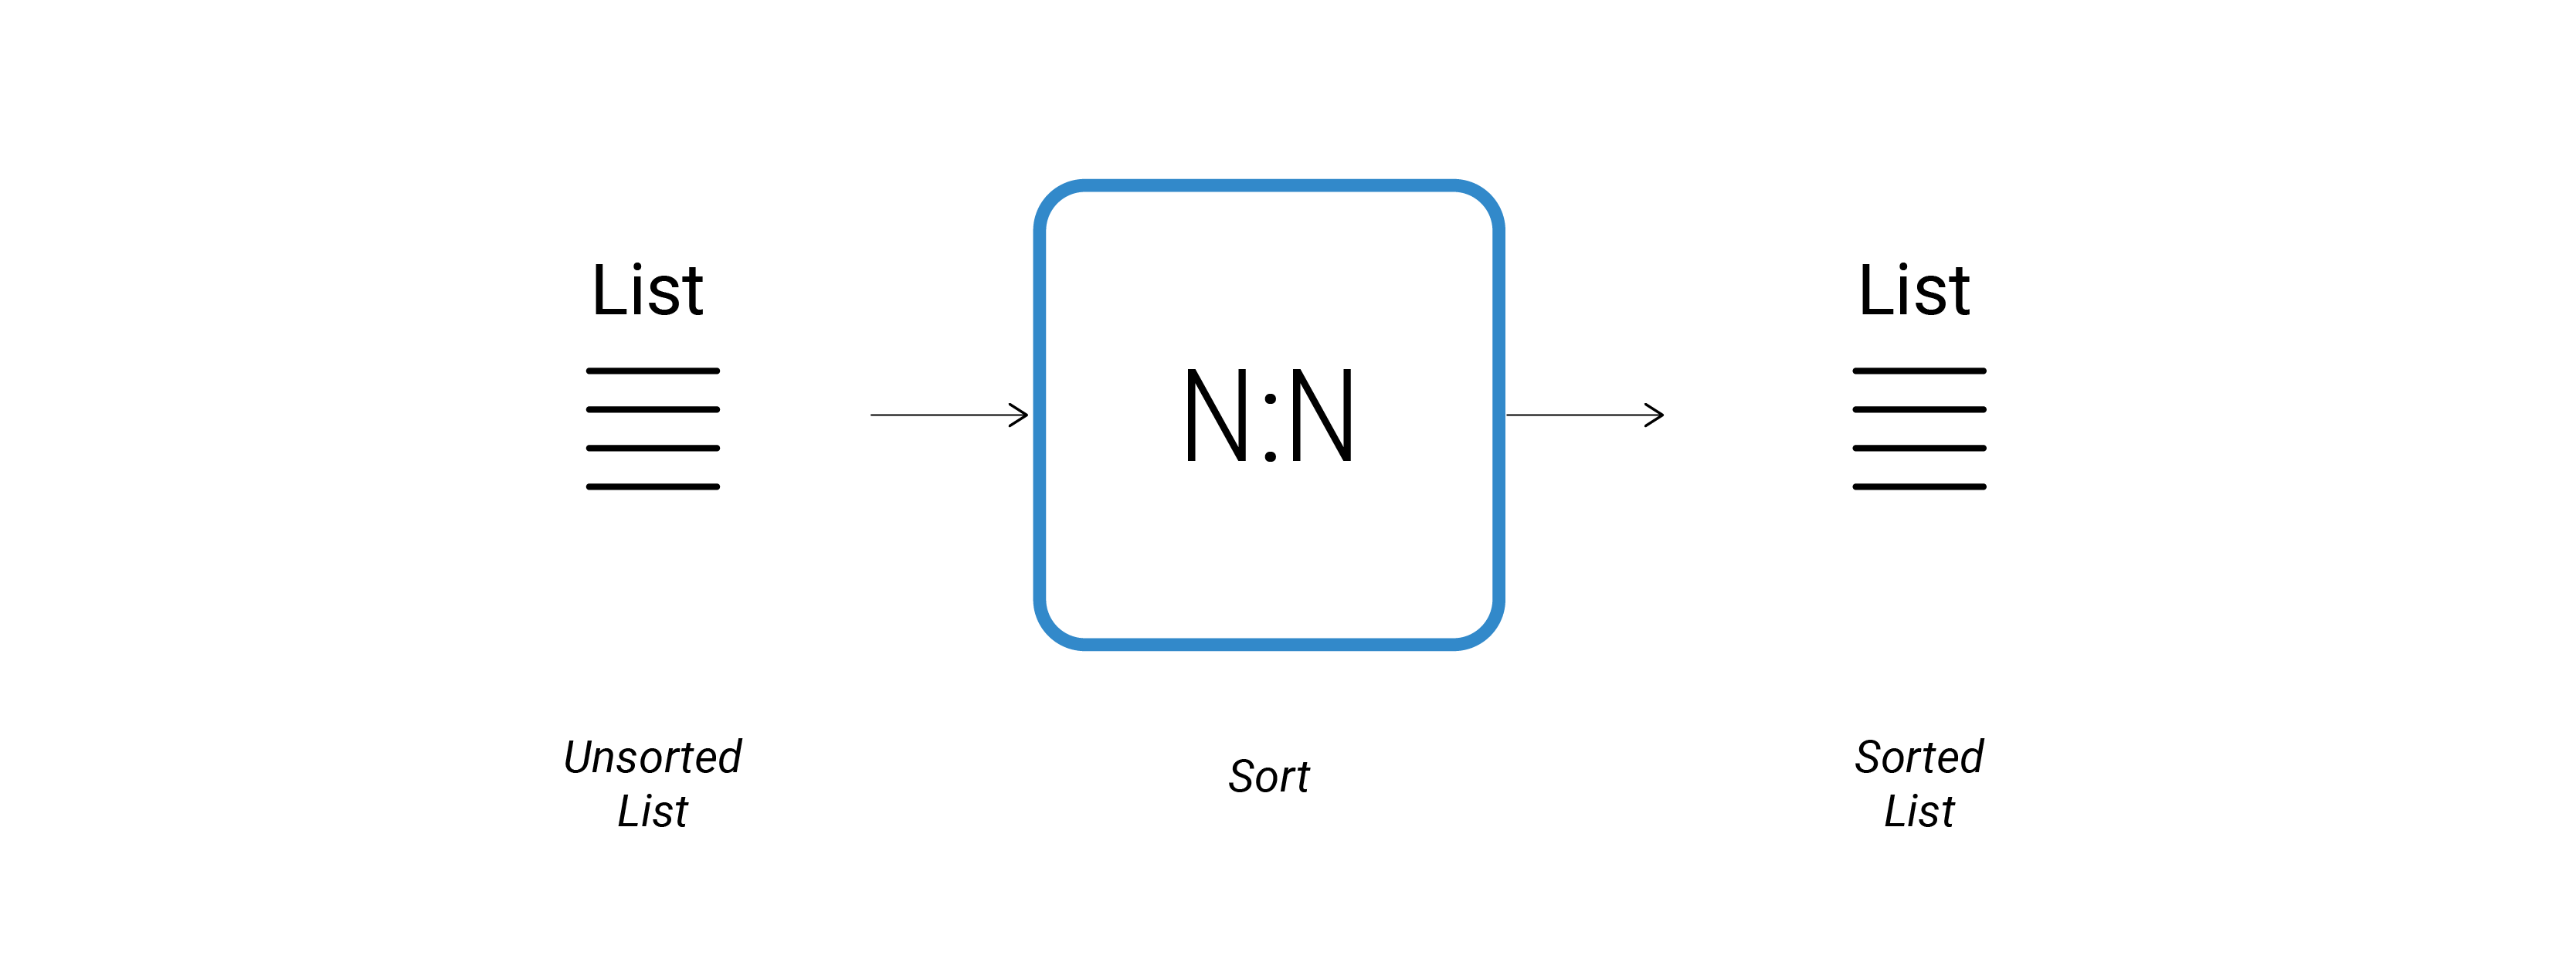
Many components only operates on lists of data and also output list of data:
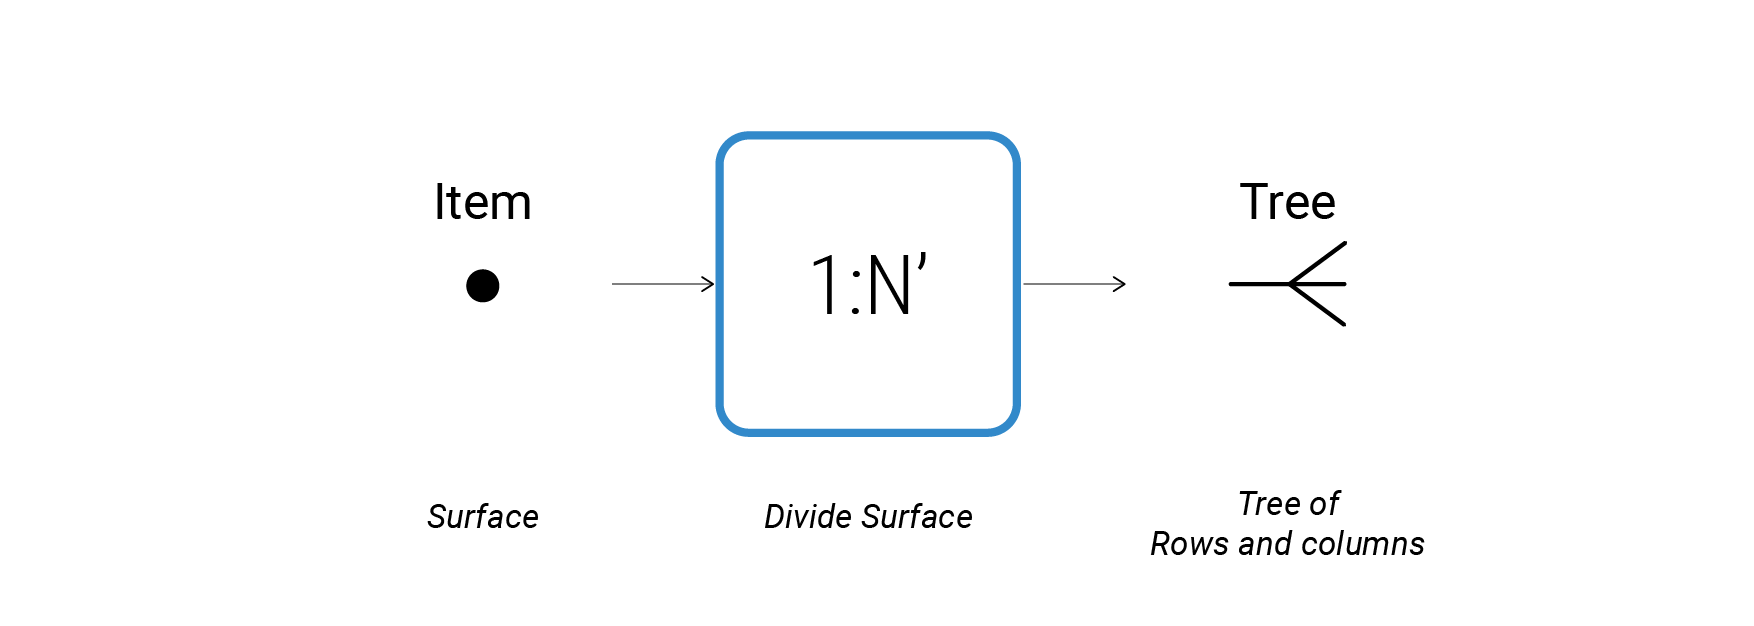
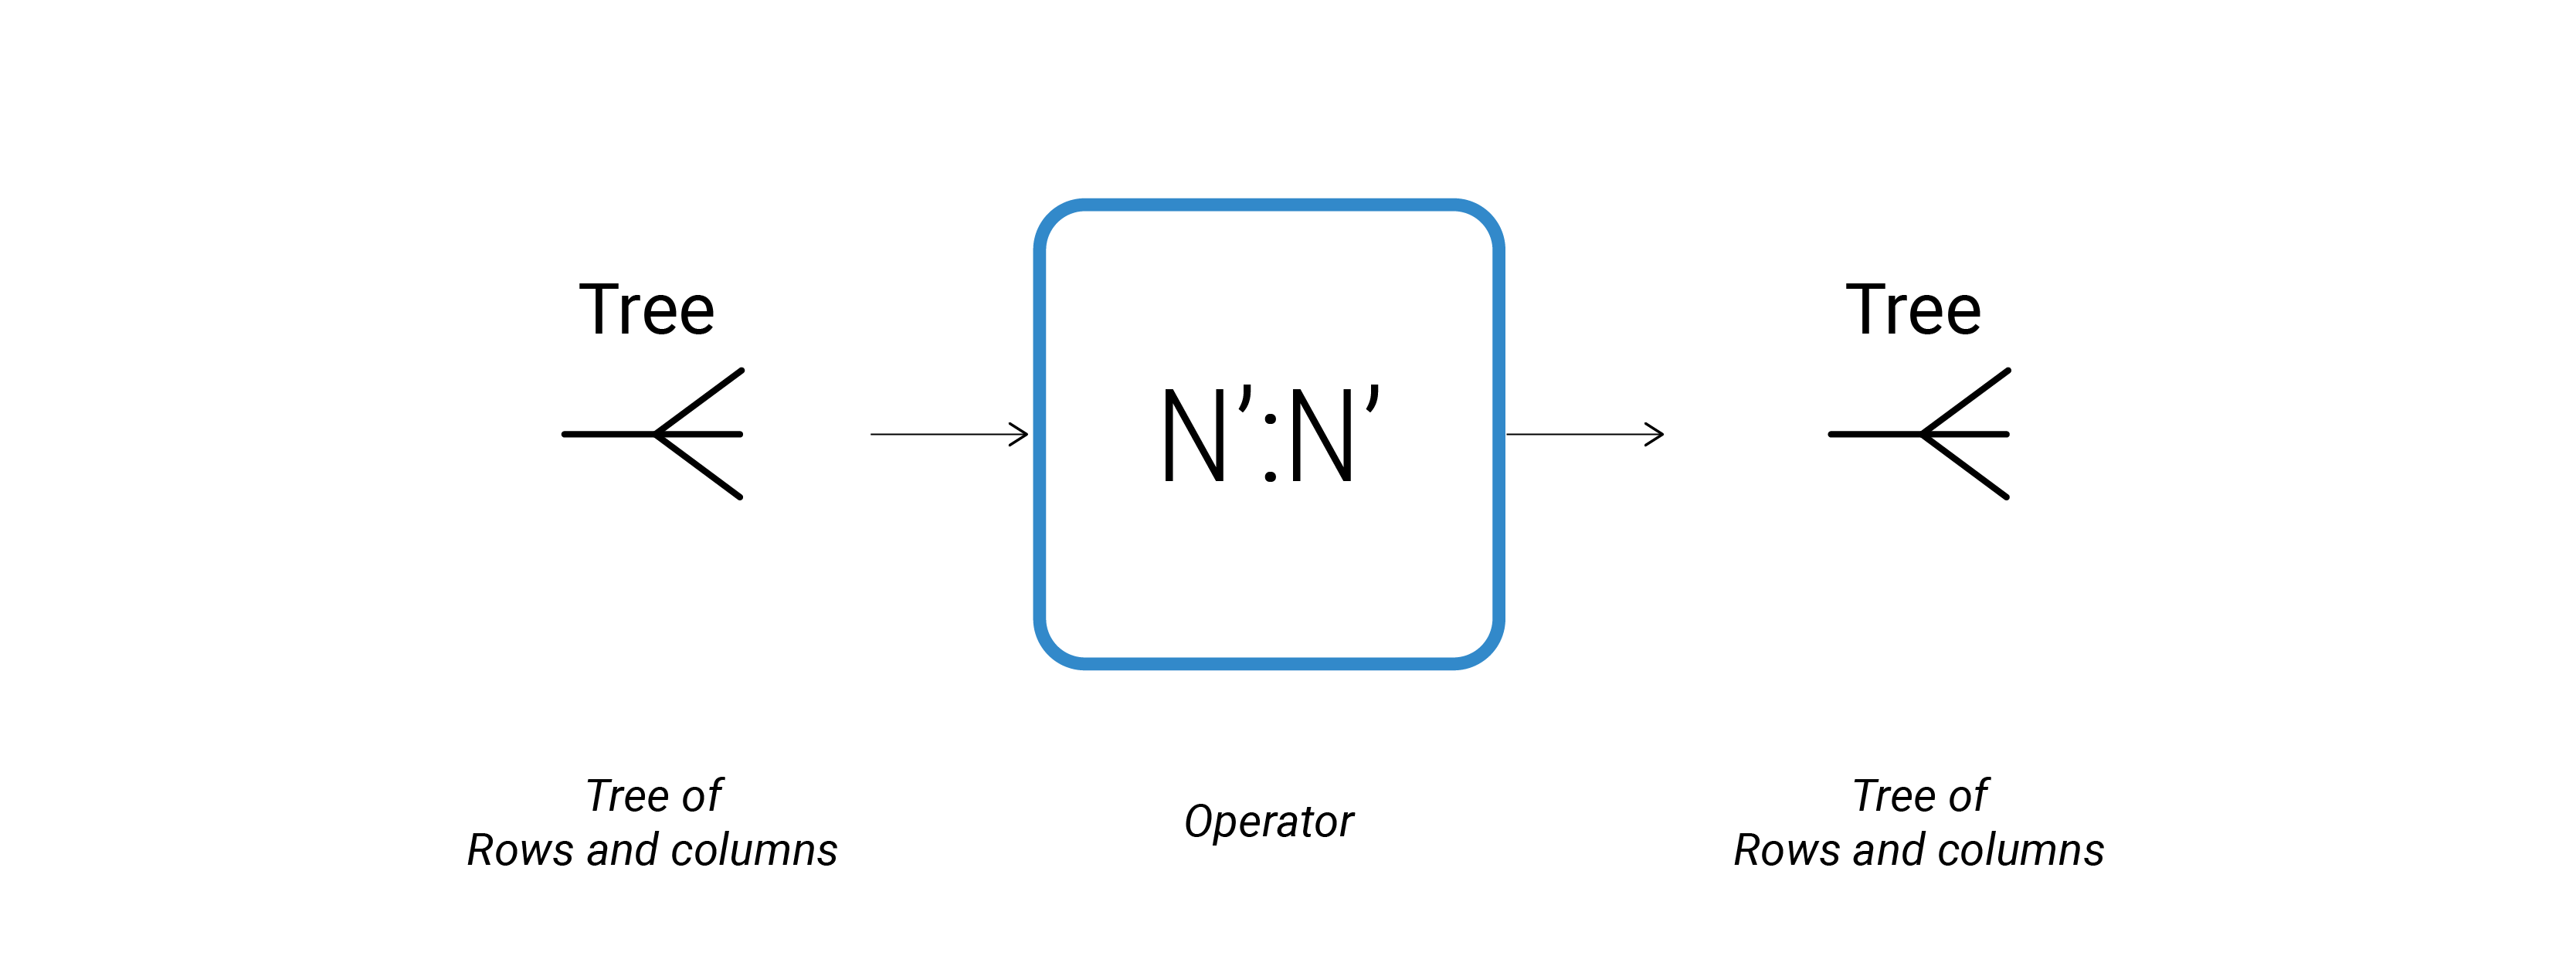
Tree level operations
Some few components output several list points, each of them representing a row or column in a grid:
We can also access to specific items in the Data Tree:
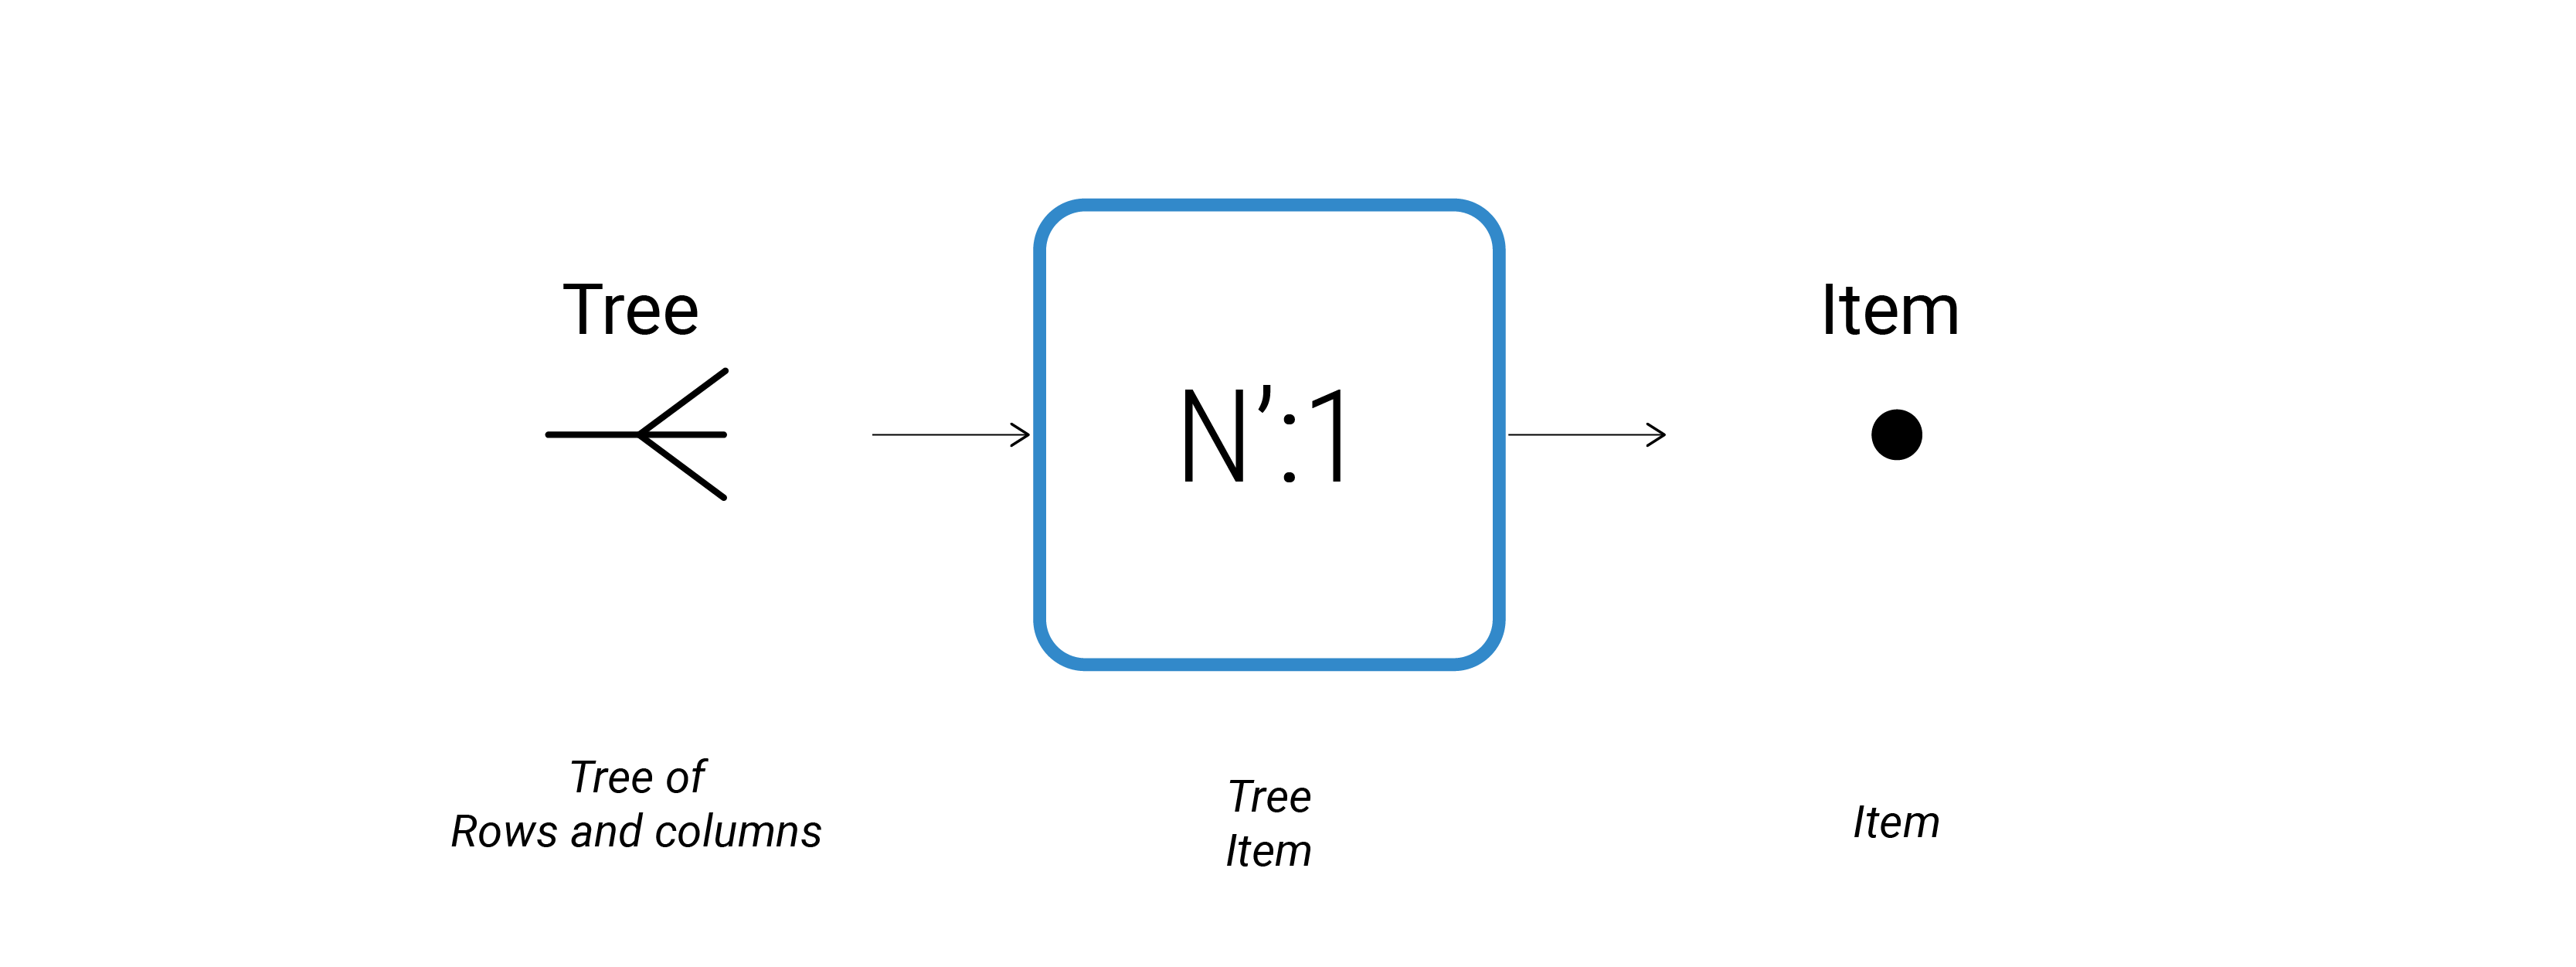
Or we can just operate them keeping or modifying its Data Tree structure:
Elements to consider in data structures
- Lists
- Index
- Items
- Paths
- Branches
- Data Tree
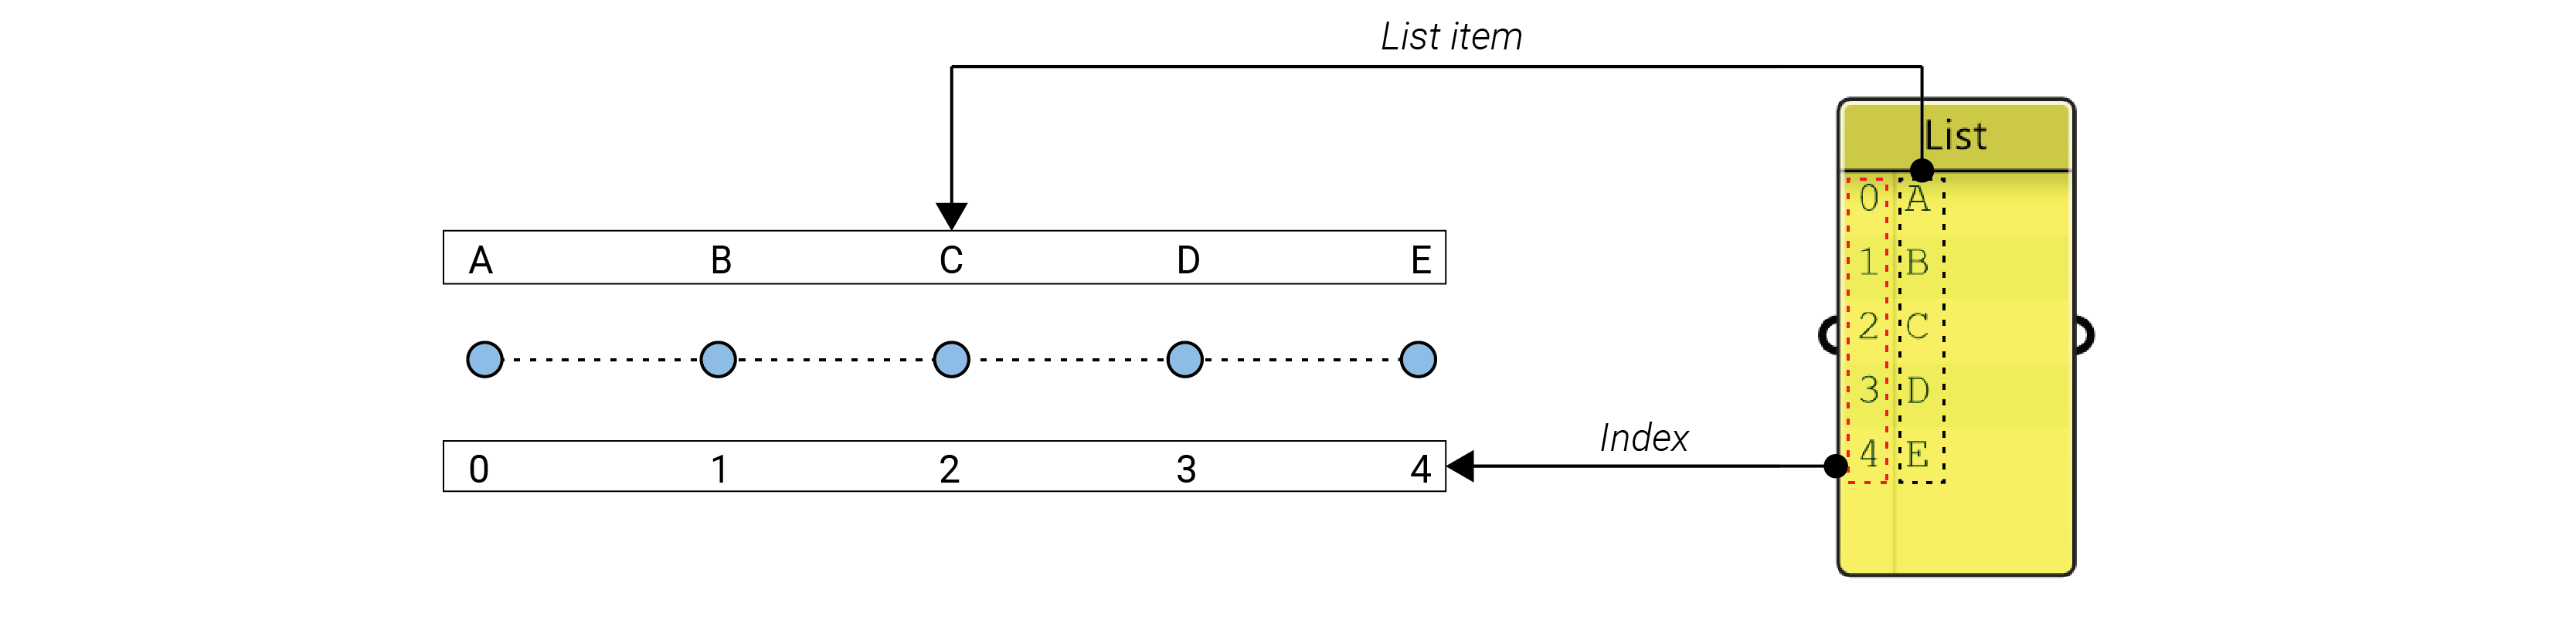
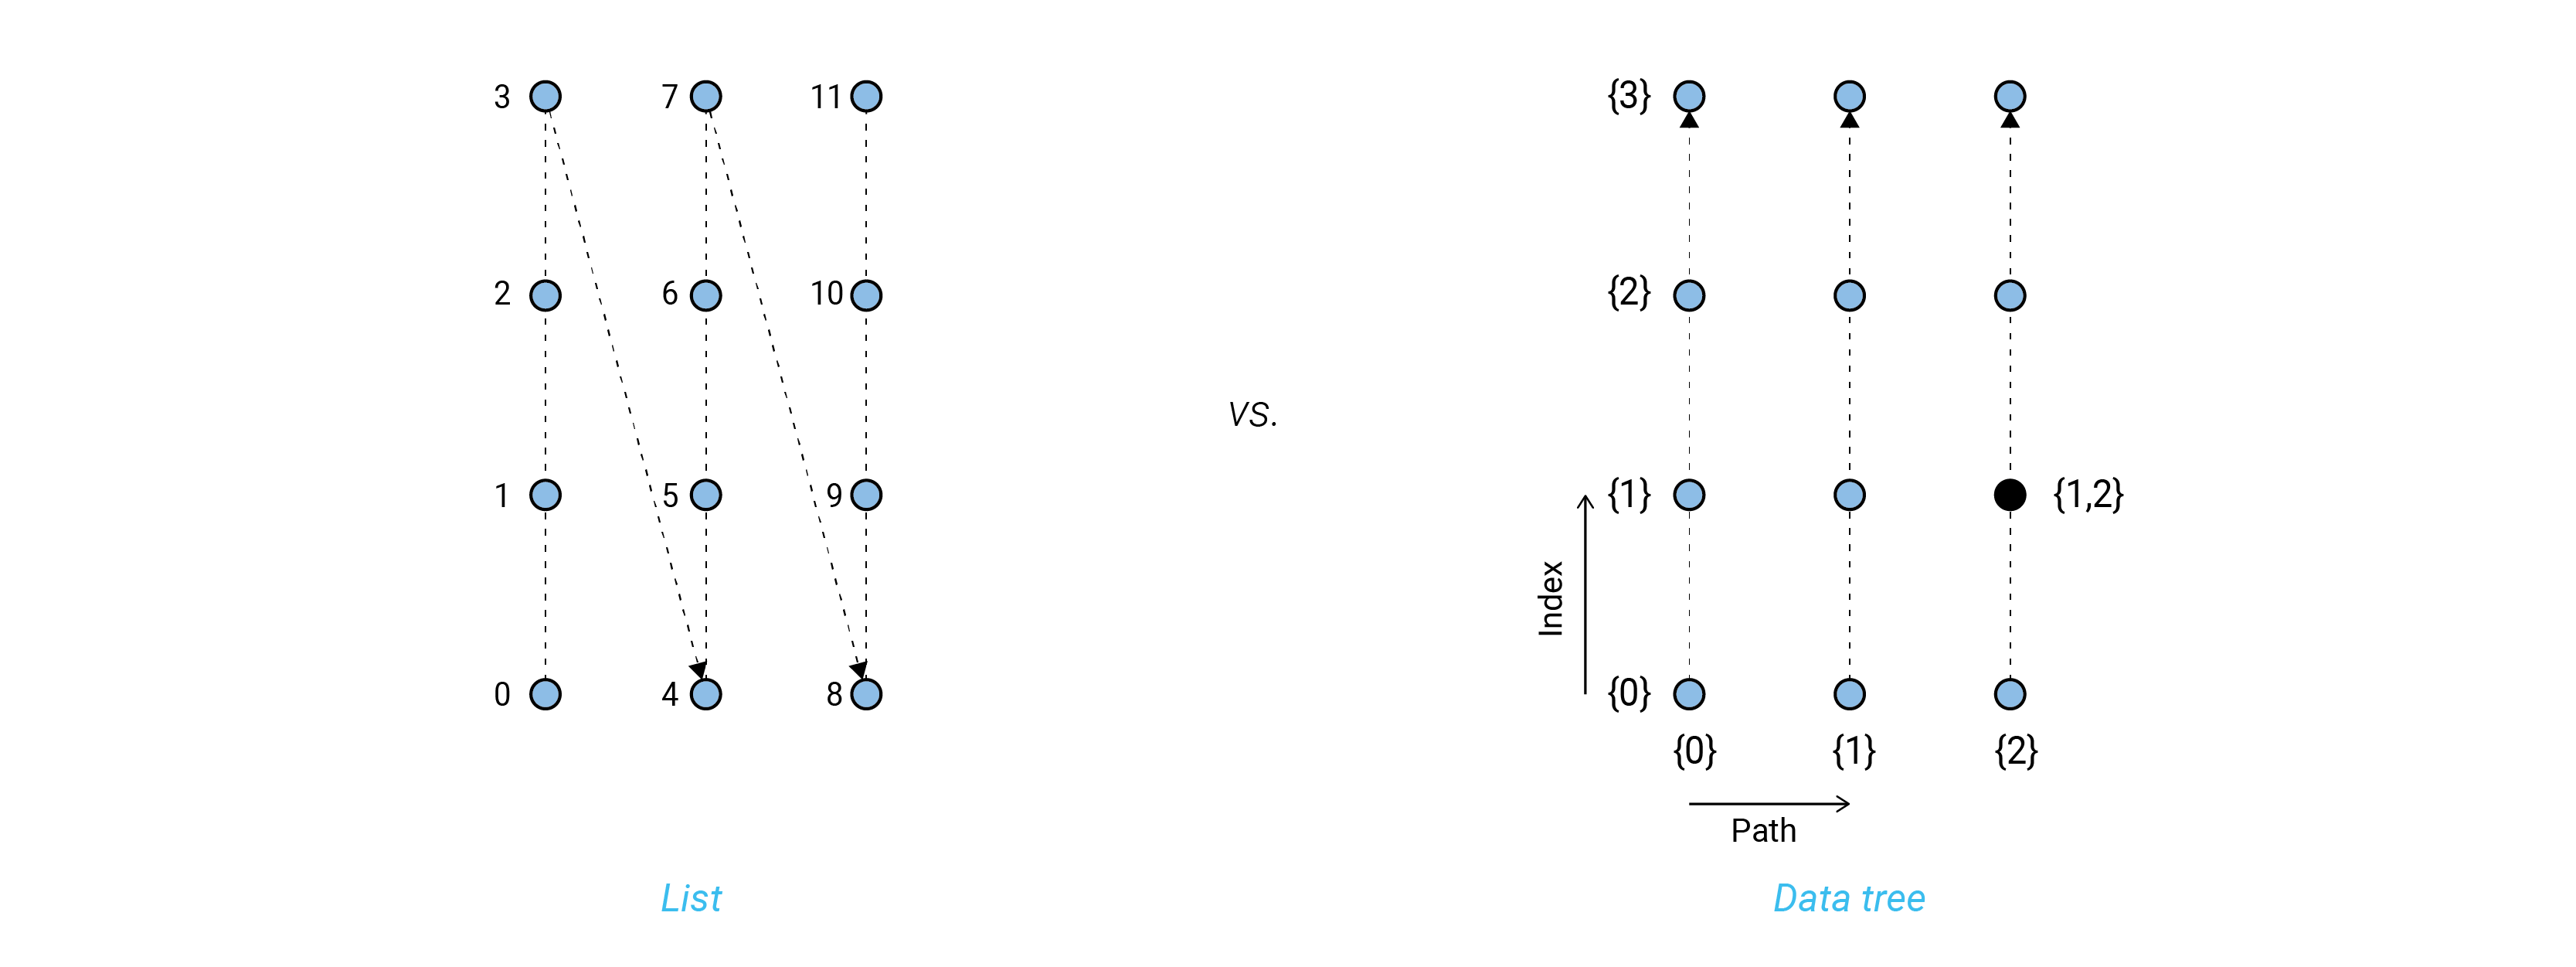
Lists
A List is an ordered (but not necessarily sorted) collection of data. Lists may contain zero elements, a single element, or many elements. The same element can occur more than once in the same list, and different elements with identical values. Also, a list may contain empty elements, referred to as nulls.
When storing data in a list, it’s important to know the position of the items in that list in order to access or manipulate them. The position of an item in a list is called Index Number.
Points, Curves, Surfaces, Meshes, etc…
List Manipulation
Most of the operation in Grasshopper will happen at List level and Grasshopper is specially good at quickly building and manipulating lists of data.
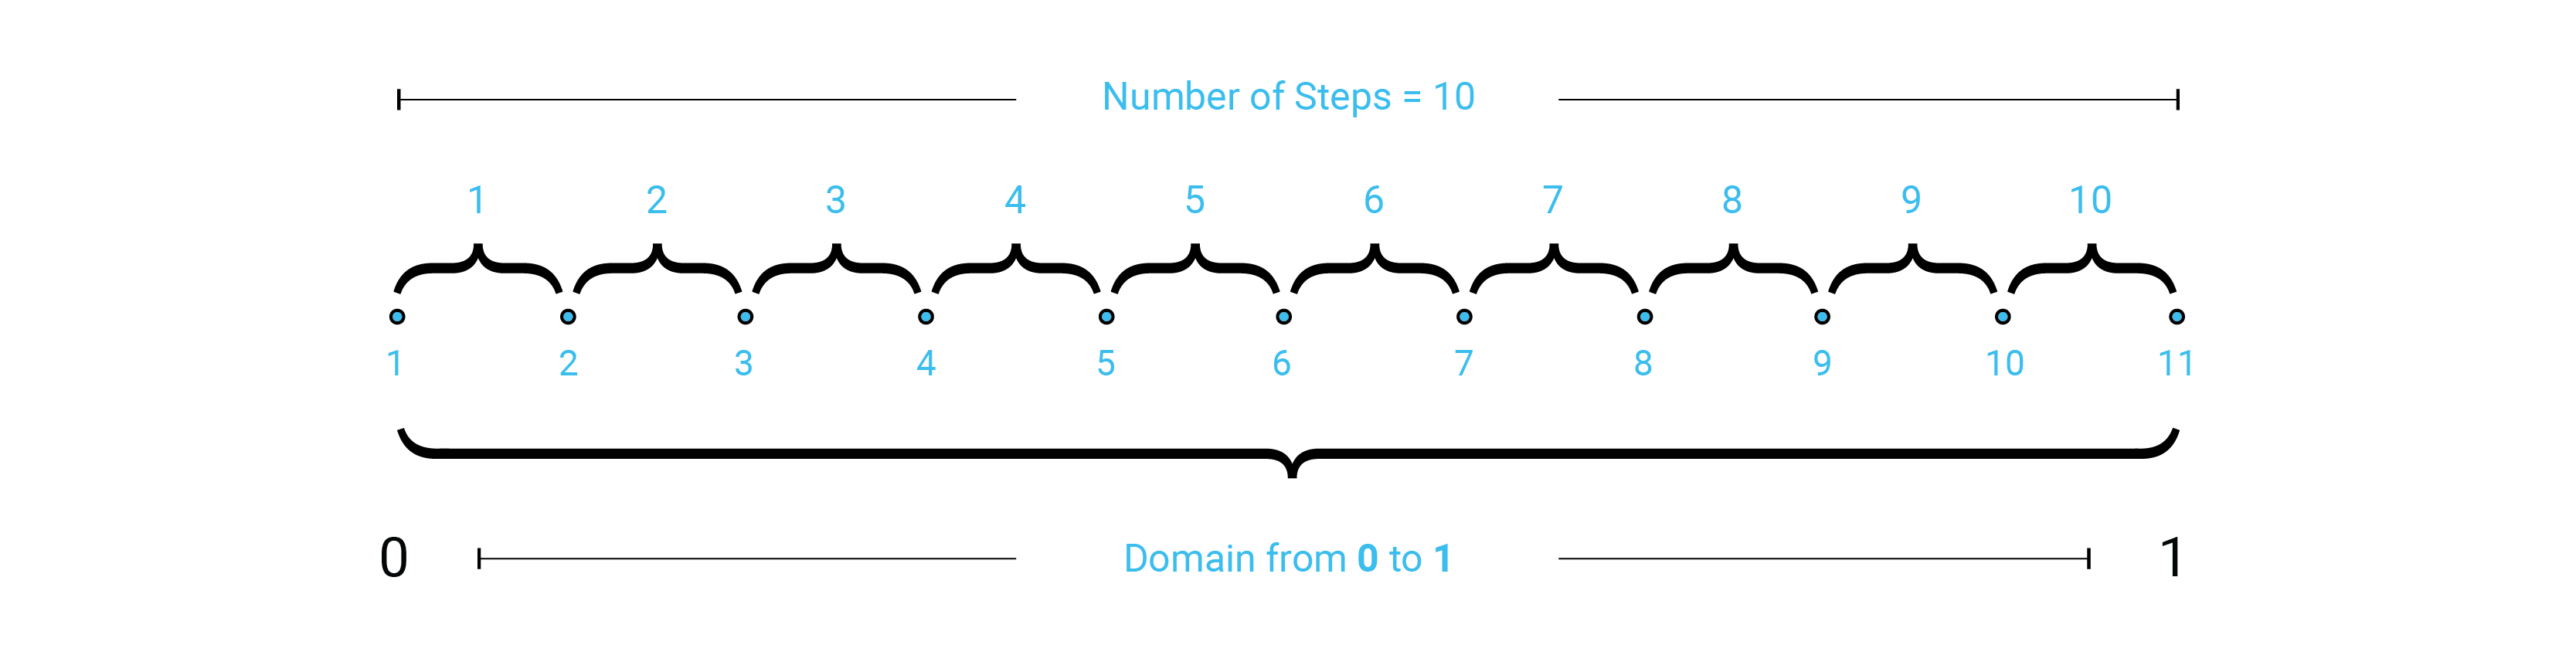
Range
List of equally spaced numbers between a Low and a High value is called Domain. A domain is every possible number between two numeric extremes.
The Range component divides a numeric domain into even segments and returns a list of values.
- Sets > Sequence > Range
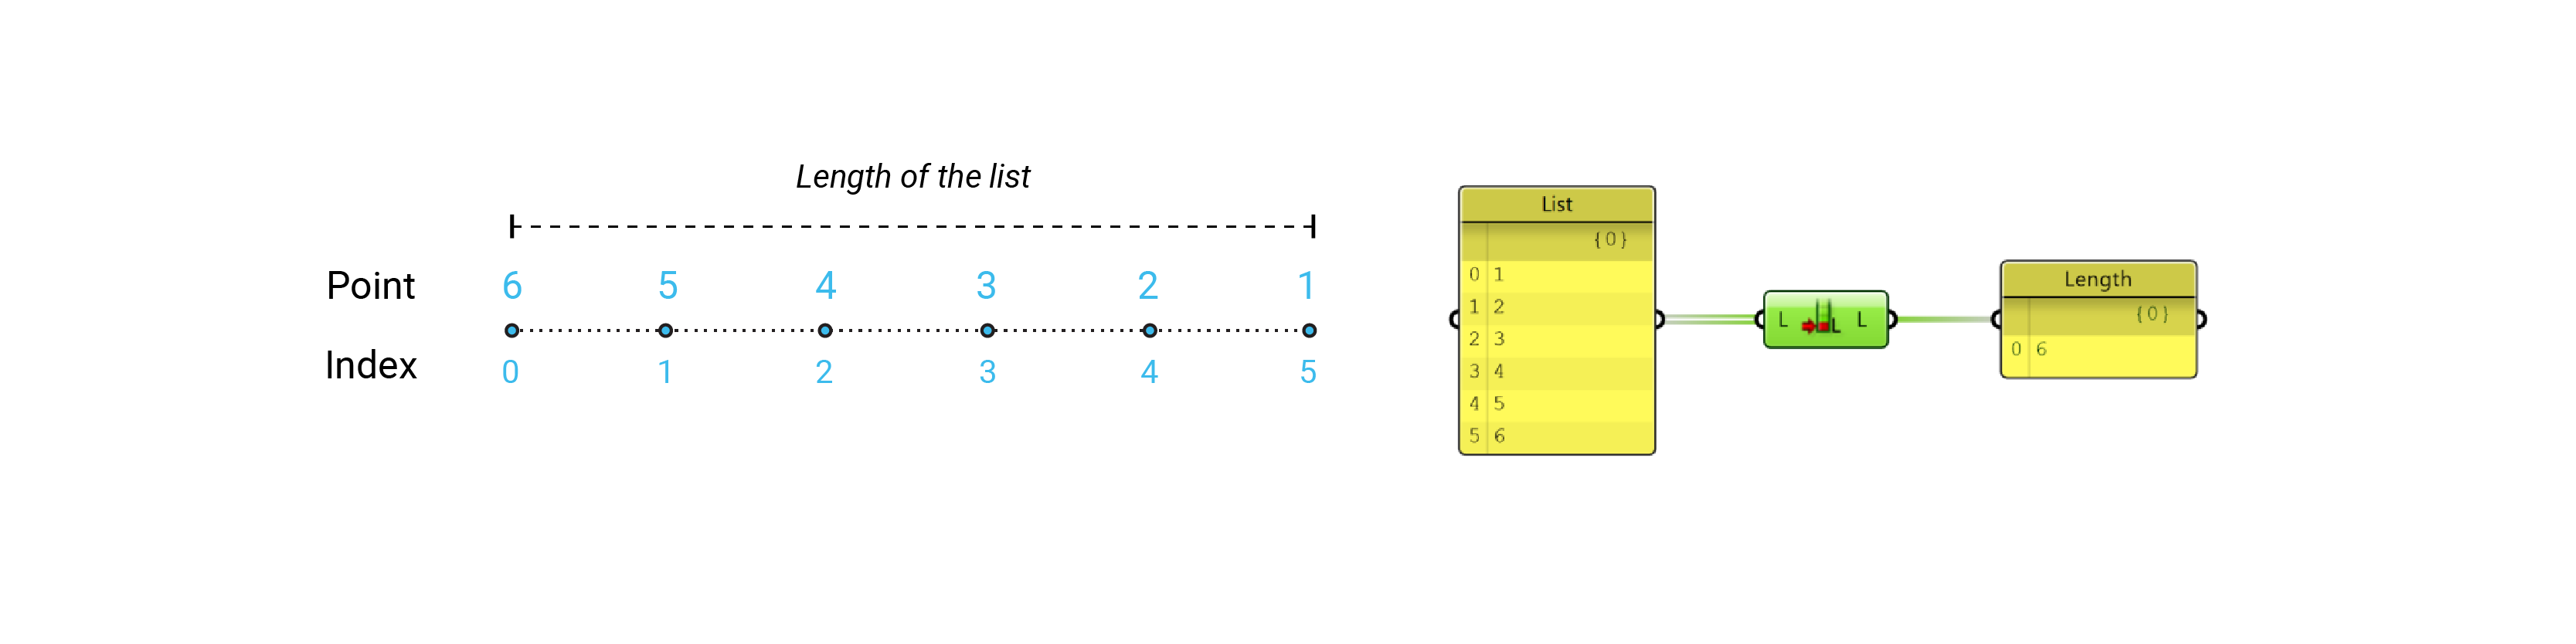
List Length
Measures the length of the List.
- Sets > List > List Length
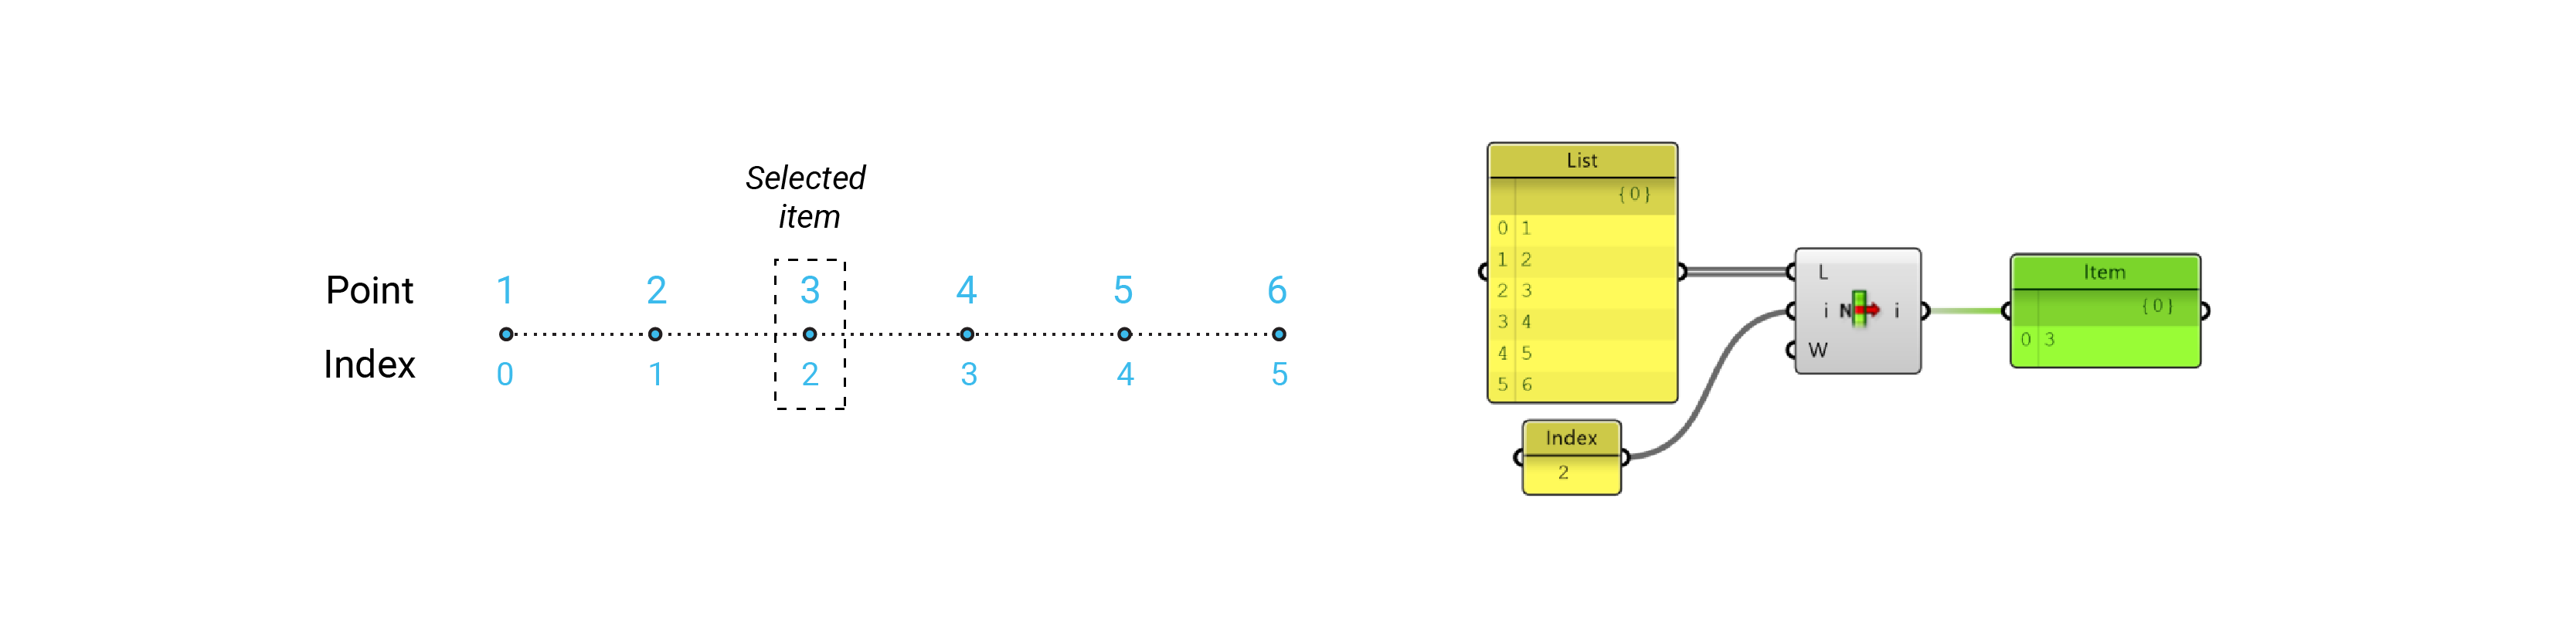
List Item
To find a specific data item from within a list.
When accessing individual items in a list, we have to specify the Index Number we would like to access, that can be a single integer or a list of integers.
- Sets > List > List Item
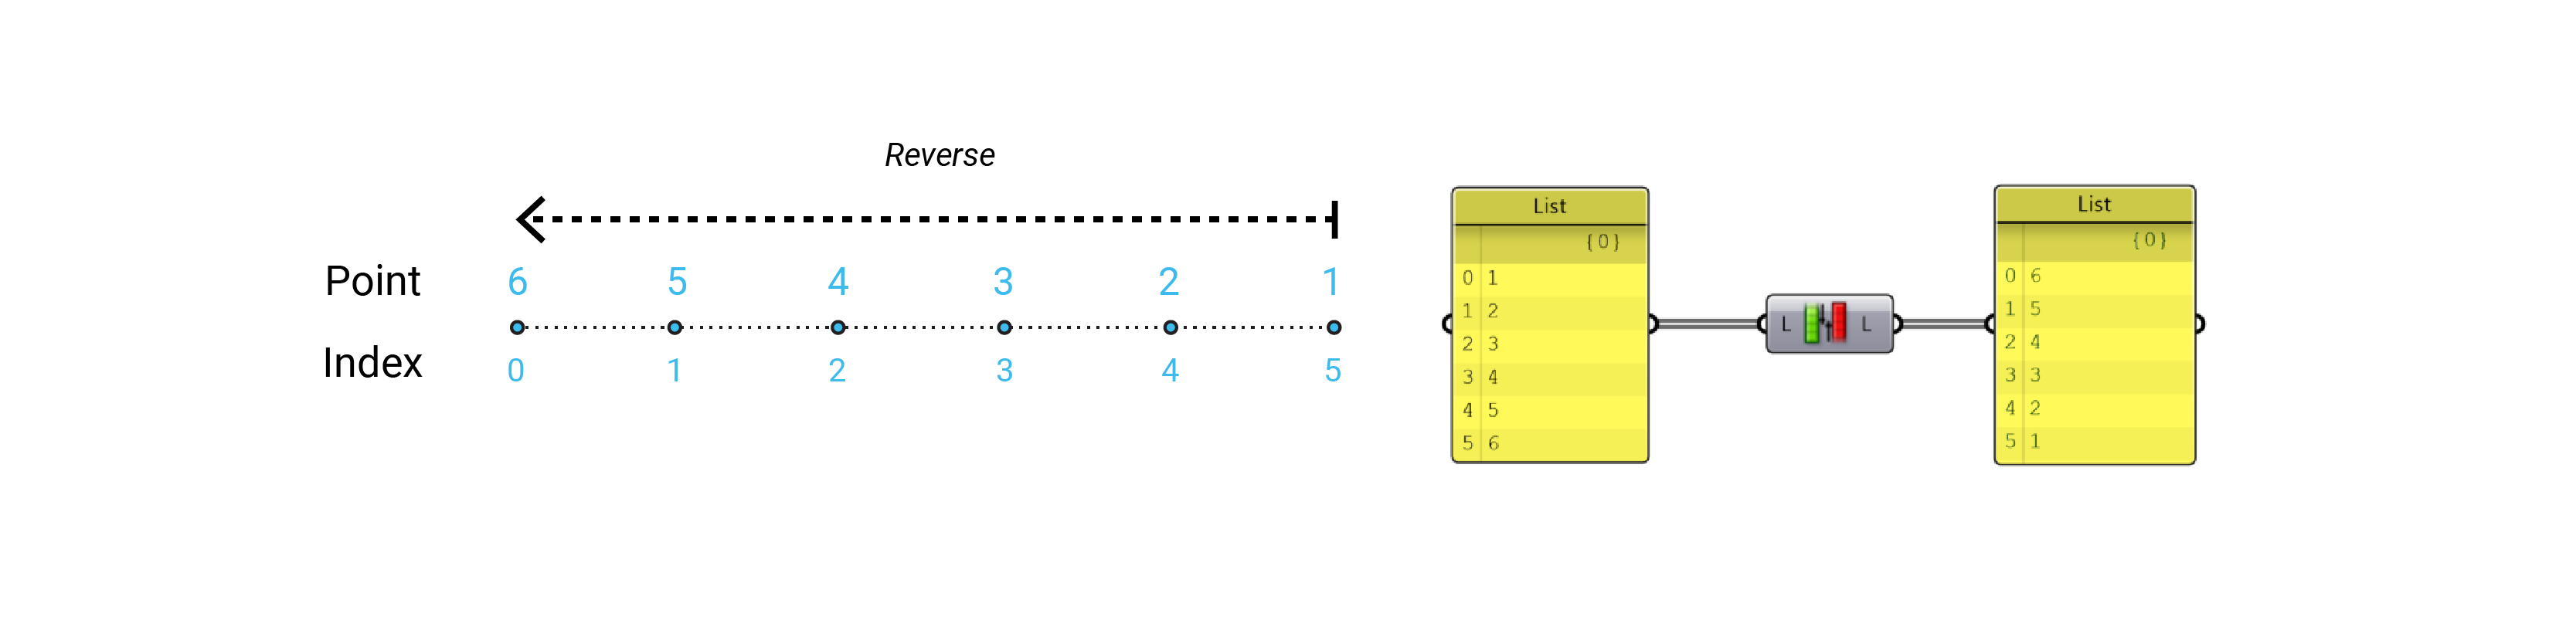
Reverse List
To invert the order of the list.
- Sets > List > Reverse List
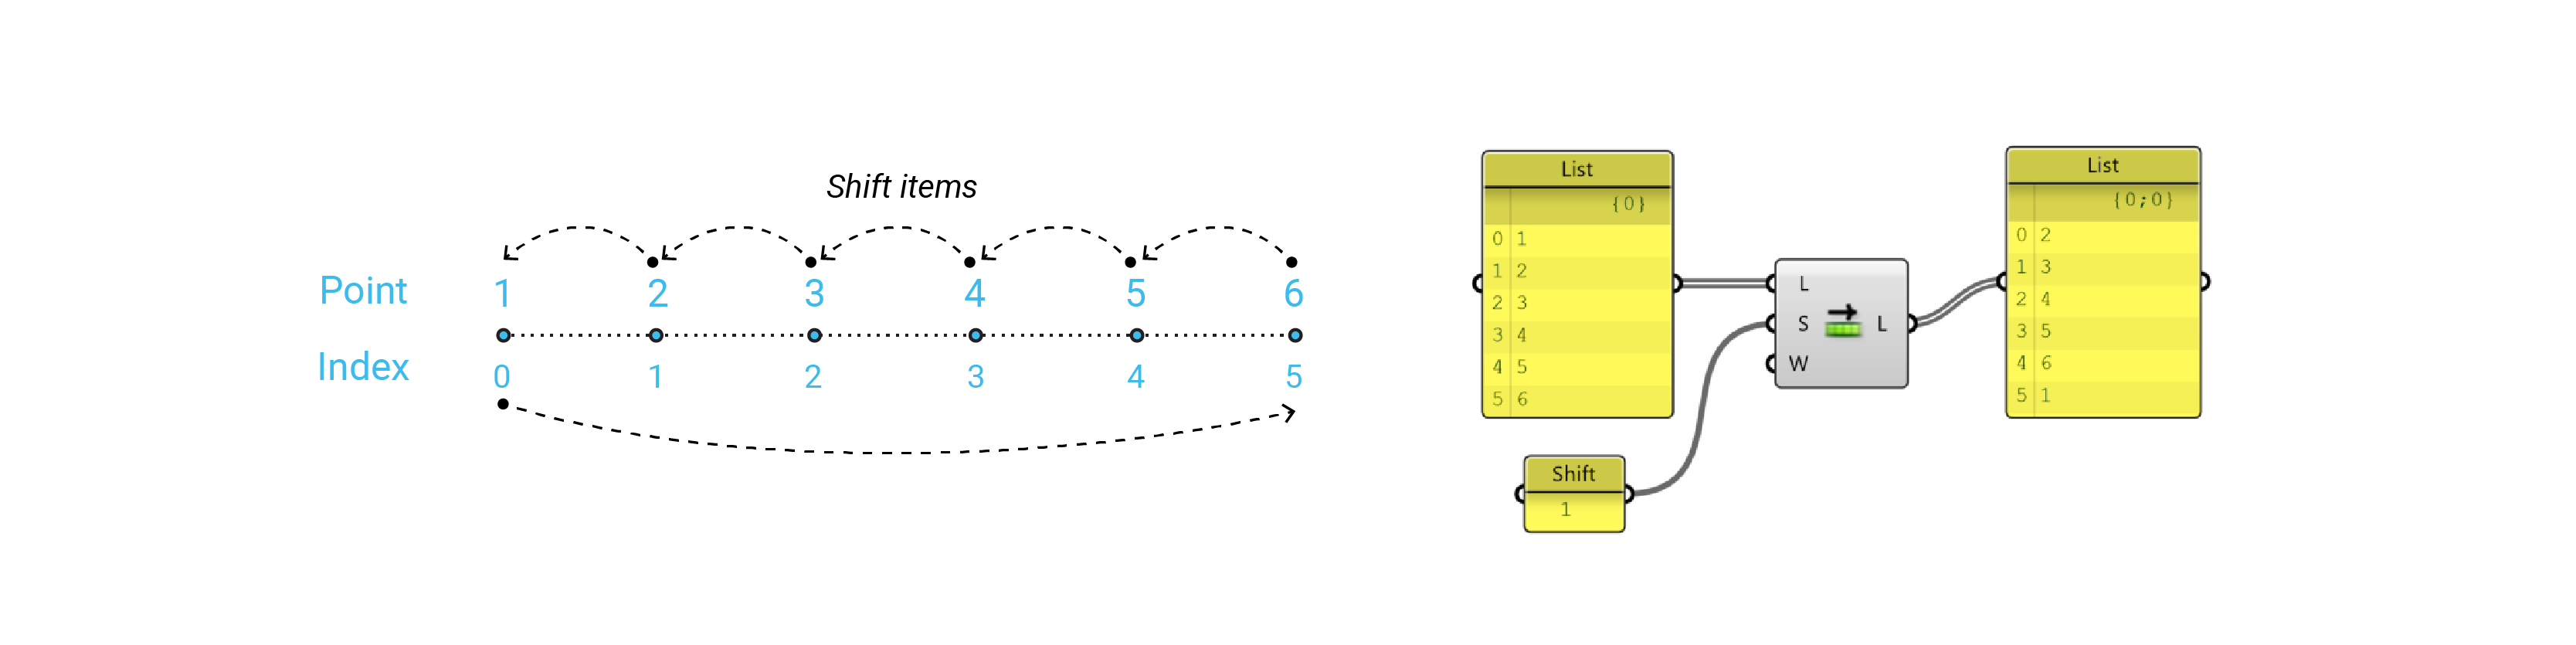
Shift List
We can move the list index up or down depending on the value of the shift offset.
If we set the “Wrap” value to False, we will remove the last value. However, if we set the “Wrap” value to True, the first entry will be moved to the bottom of the list.
- Sets > List > Shift List
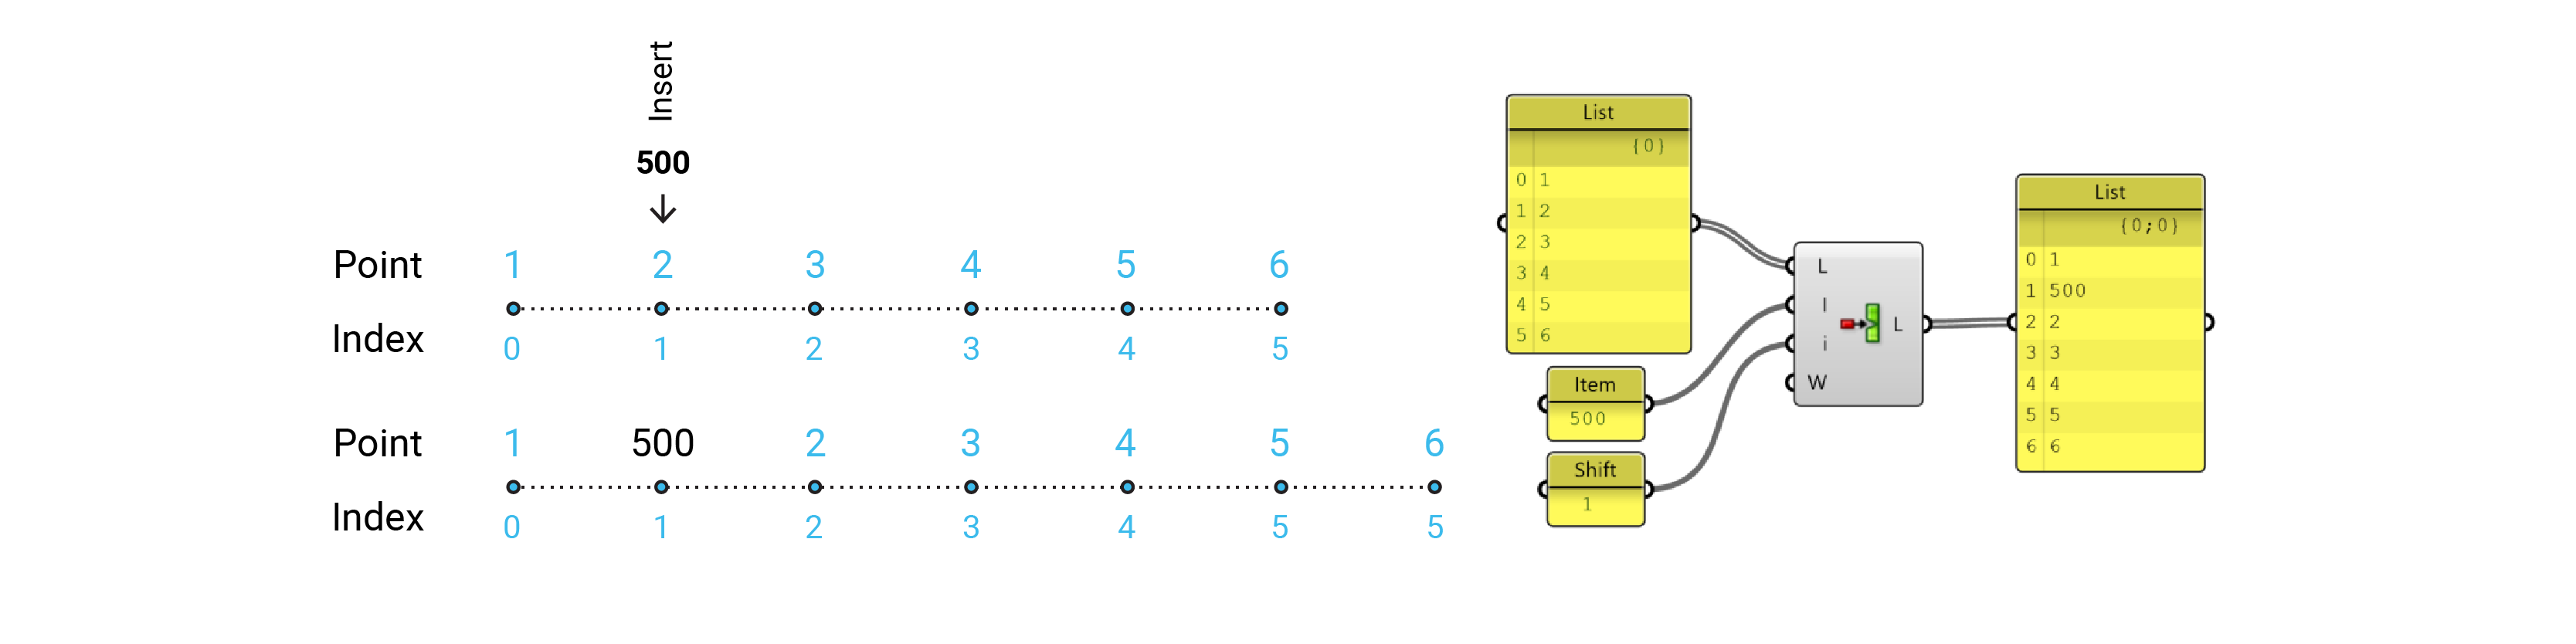
Insert Item
Insert a collection of items into a list.
You need to know the items you want to insert and the index position.
- Sets > List > Insert Item
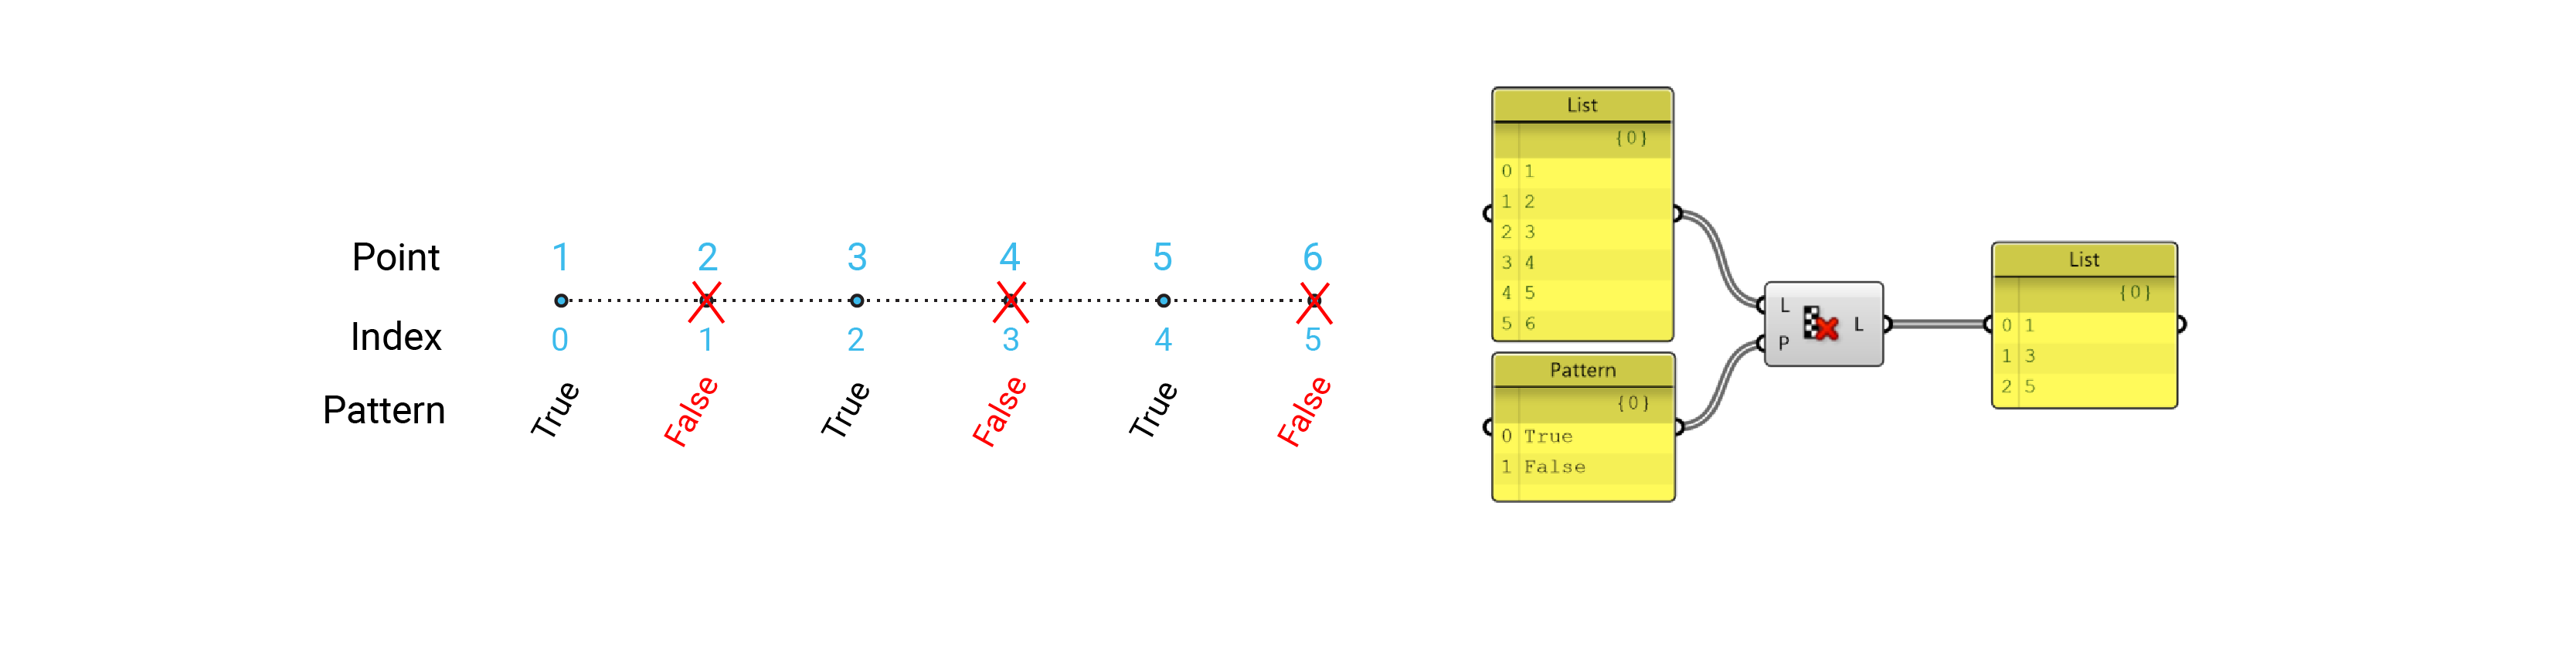
Cull Pattern
Removes elements in a list using a repetitive pattern.
The pattern is defined as a list of Boolean values (True or False).
- Sets > Sequence > Cull Pattern
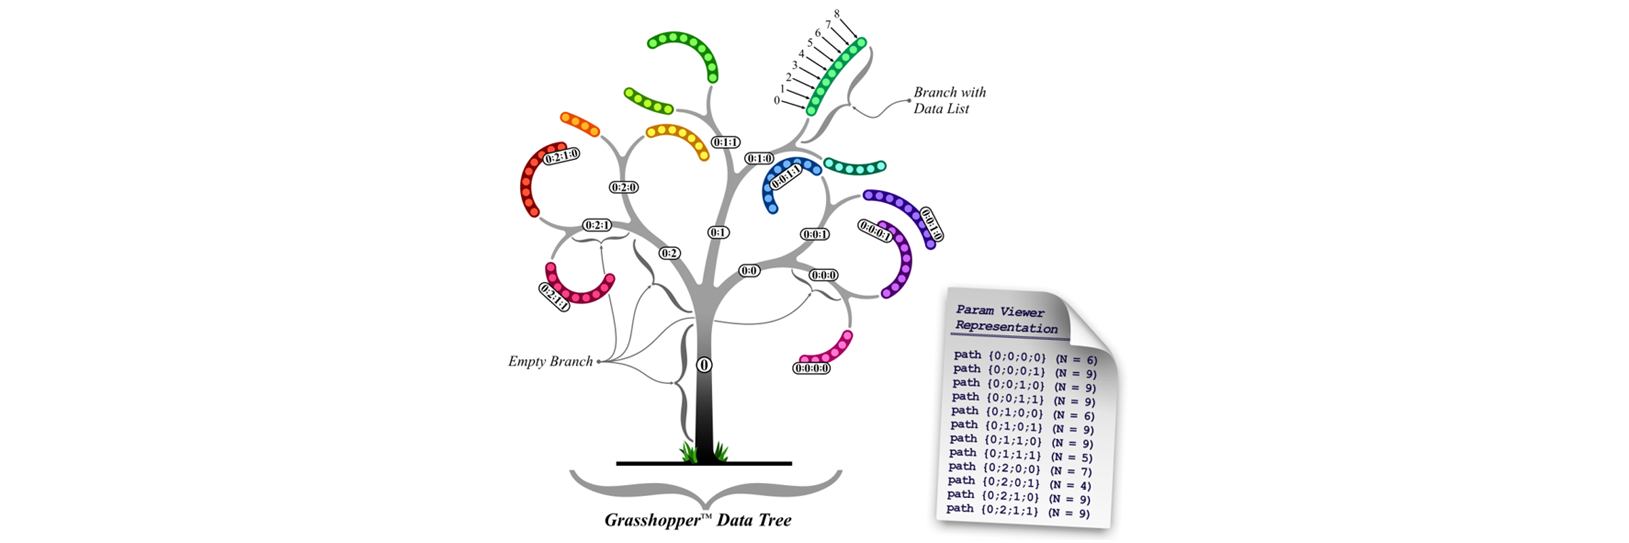
Data Tree
It is important to understand how large quantities of data are stored, accessed, and manipulated.
A Data Tree is a hierarchical structure for storing data in Nested Lists or Sub-Lists.
These nested sub-lists work in the same way as folder structures on your computer in that accessing indexed items require moving through paths that are informed by their generation of parent lists and their own sub-index.
Difference between List (Flatten) and Data Tree (Graft):
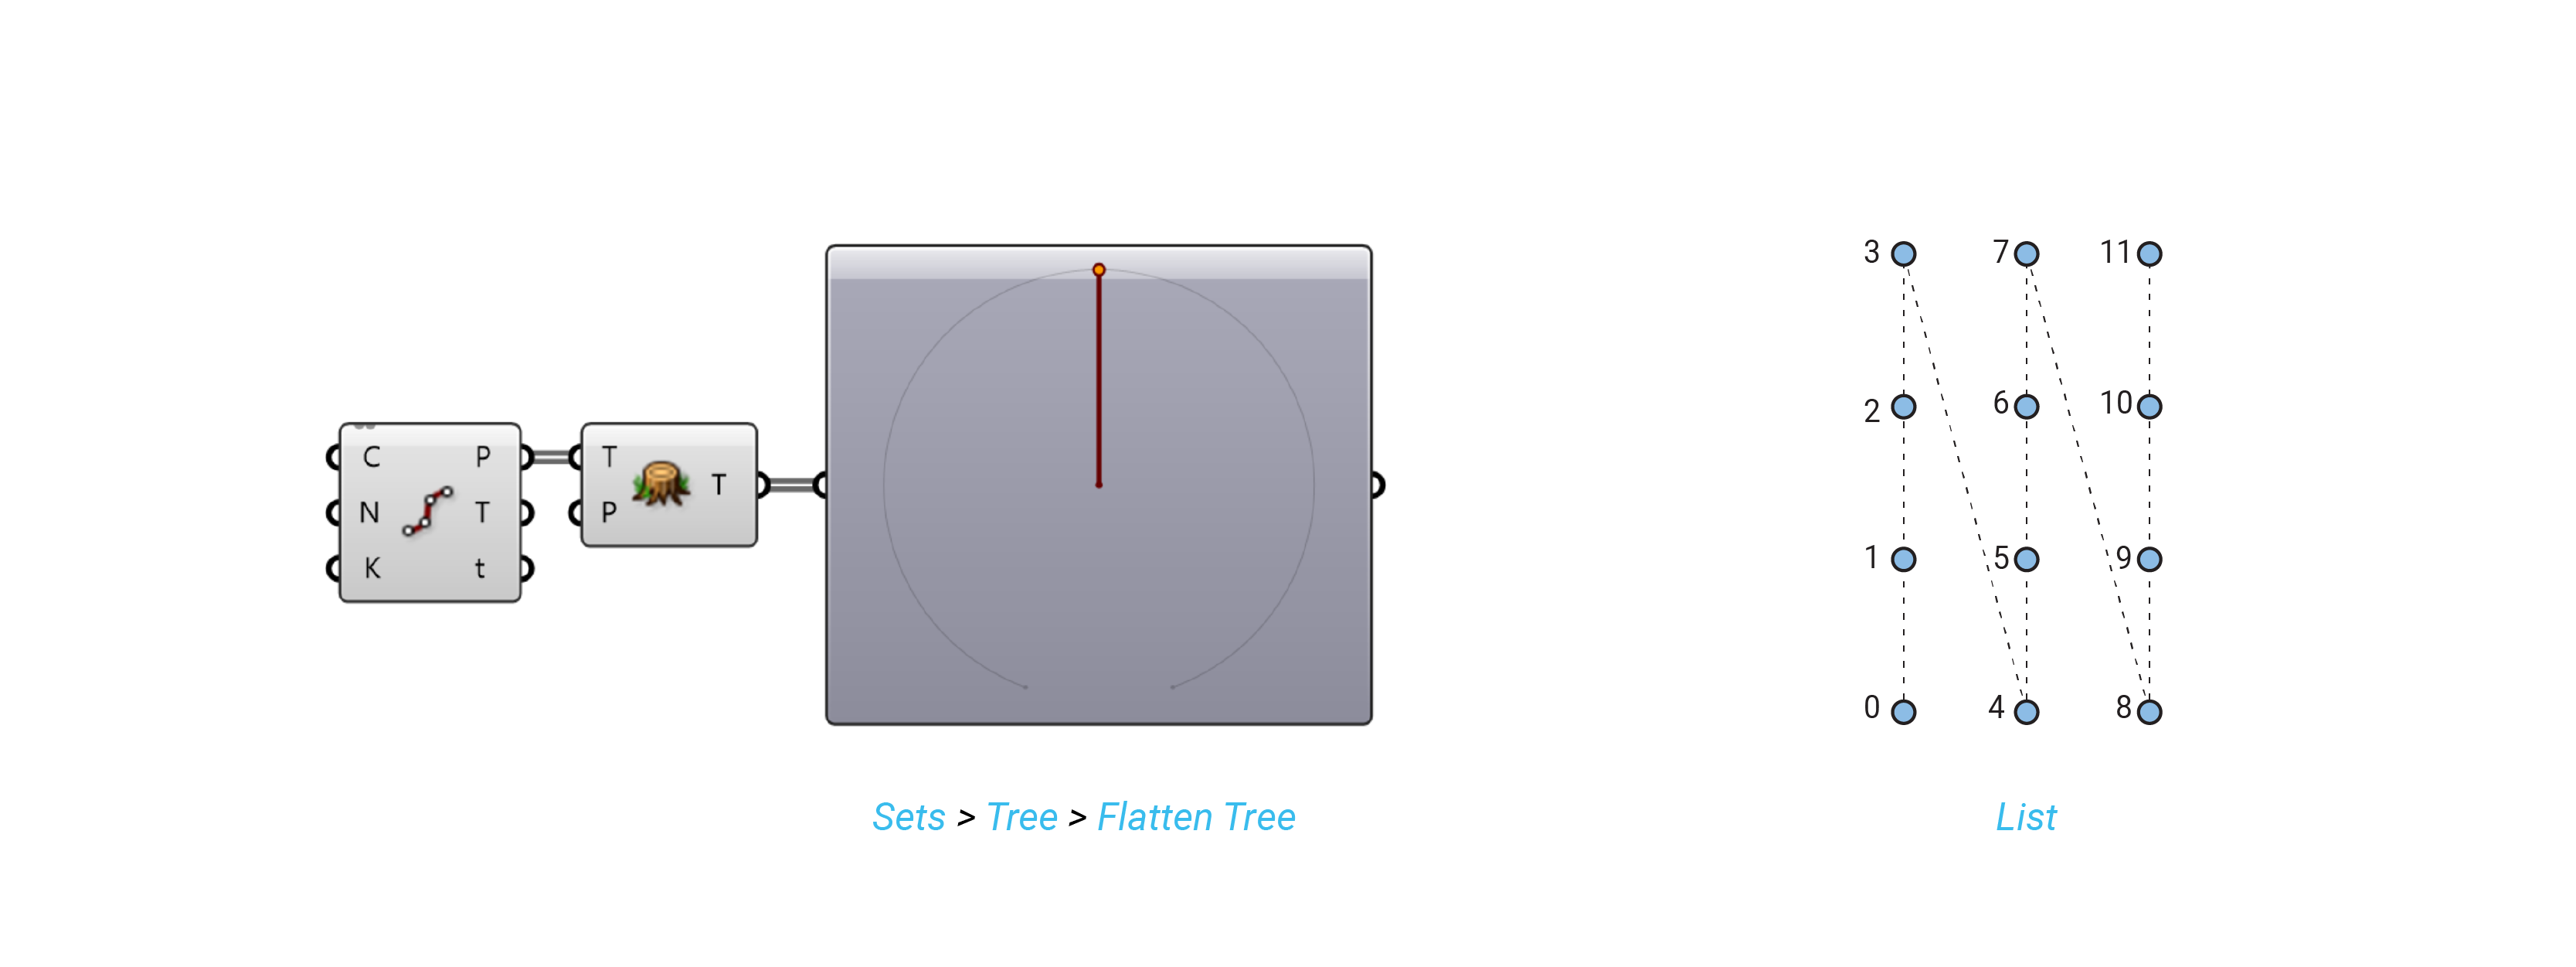
Flatten tree
Flatten removes all levels of a Data Tree, resulting in a single List.
- Sets > Tree > Flatten Tree
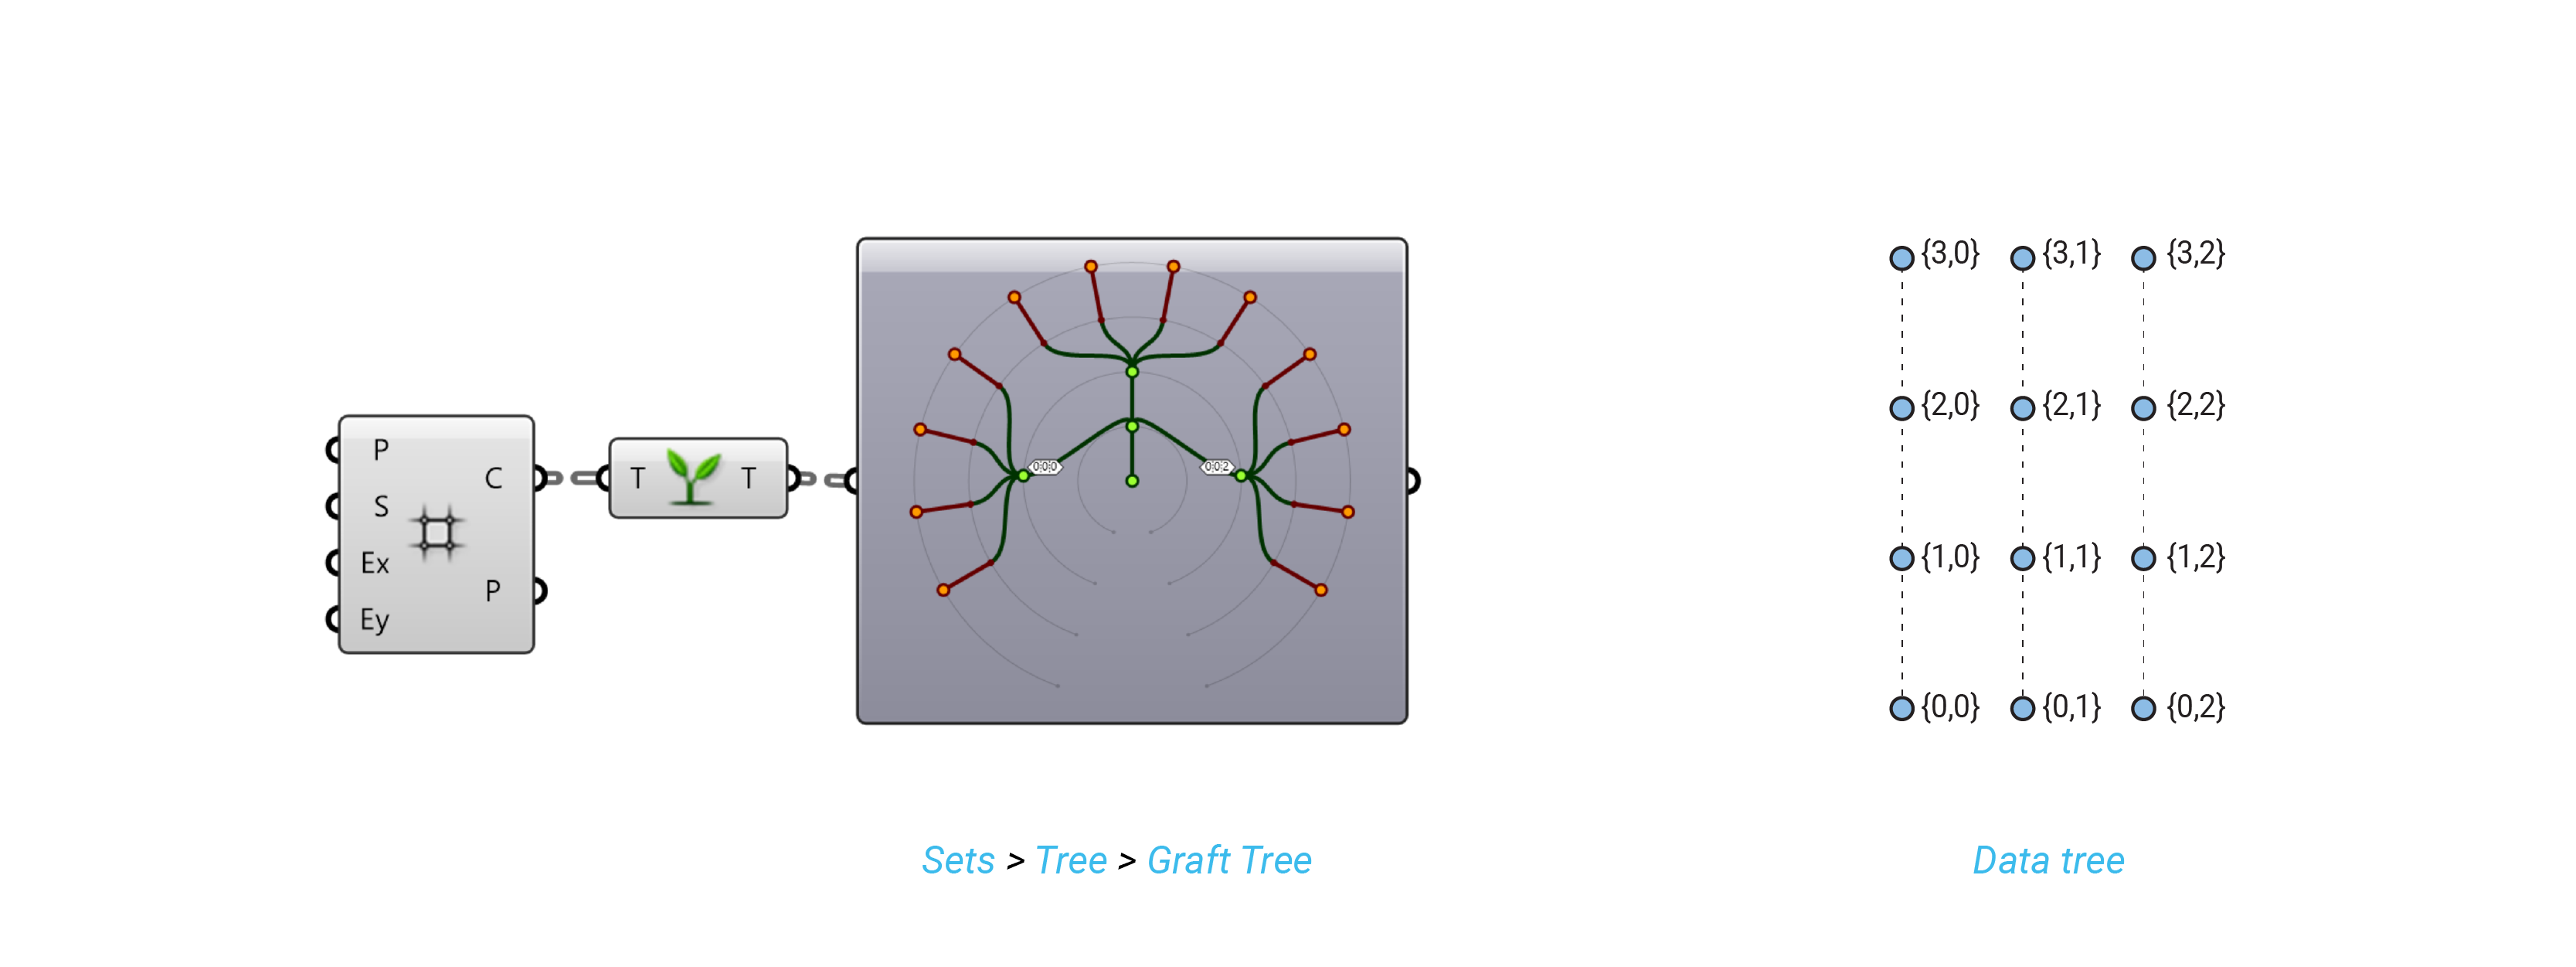
Graft Tree
Graft Tree creates a new Branch for every Data Item.
- Sets > Tree > Graft Tree
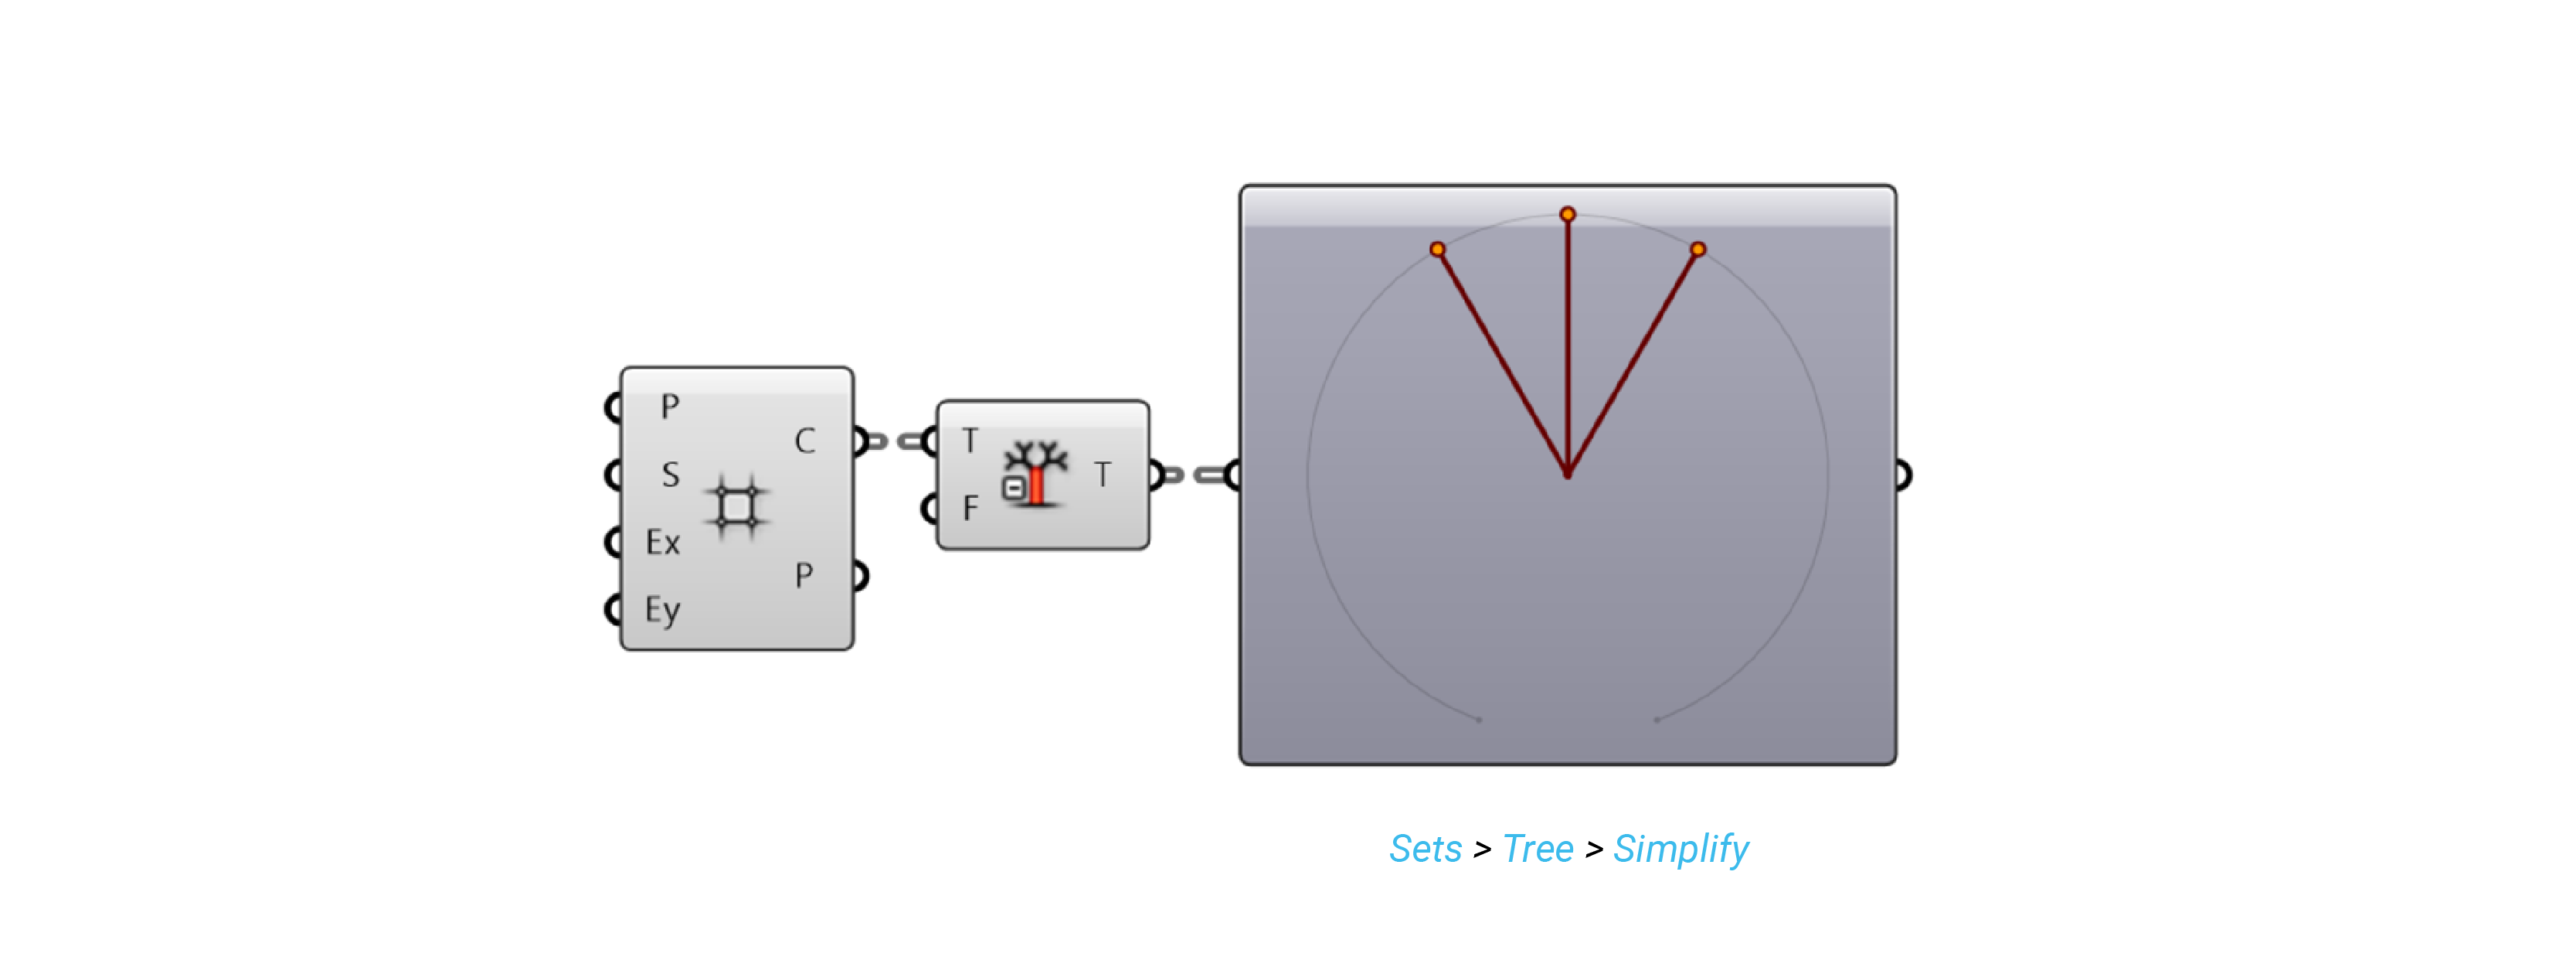
Simplify tree
Simplify a data tree by removing the overlap shared amongst all branches.
- Sets > Tree > Simplify Tree
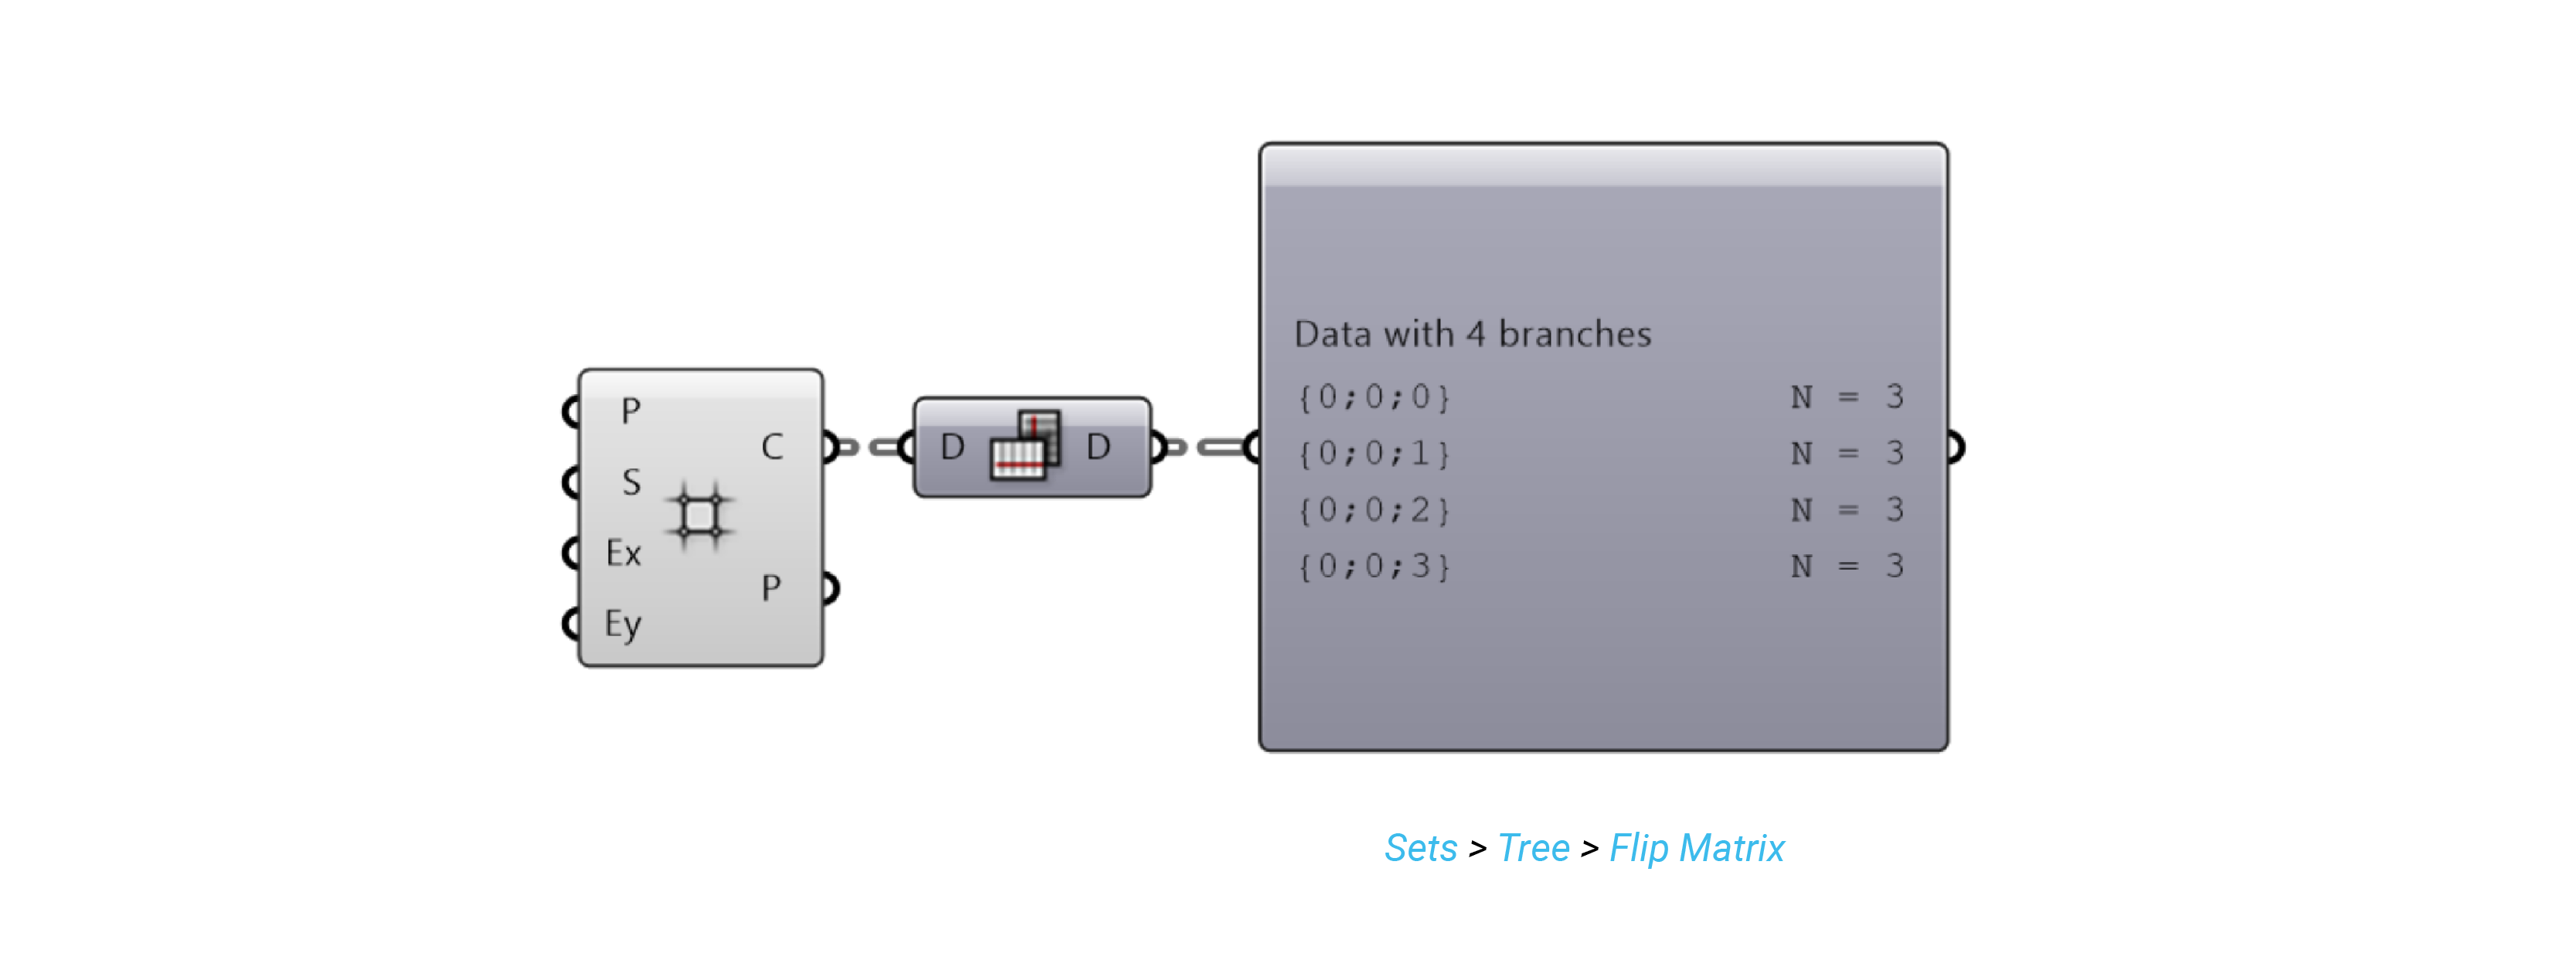
Flip Matrix
Flip Matrix component Swaps the “Rows” and “Columns” of a Data Tree with two Path Indices.
- Sets > Tree > Flip Matrix
Data visualization
We can visualize the Indices and Items in different ways in order to understand and manipulate them:
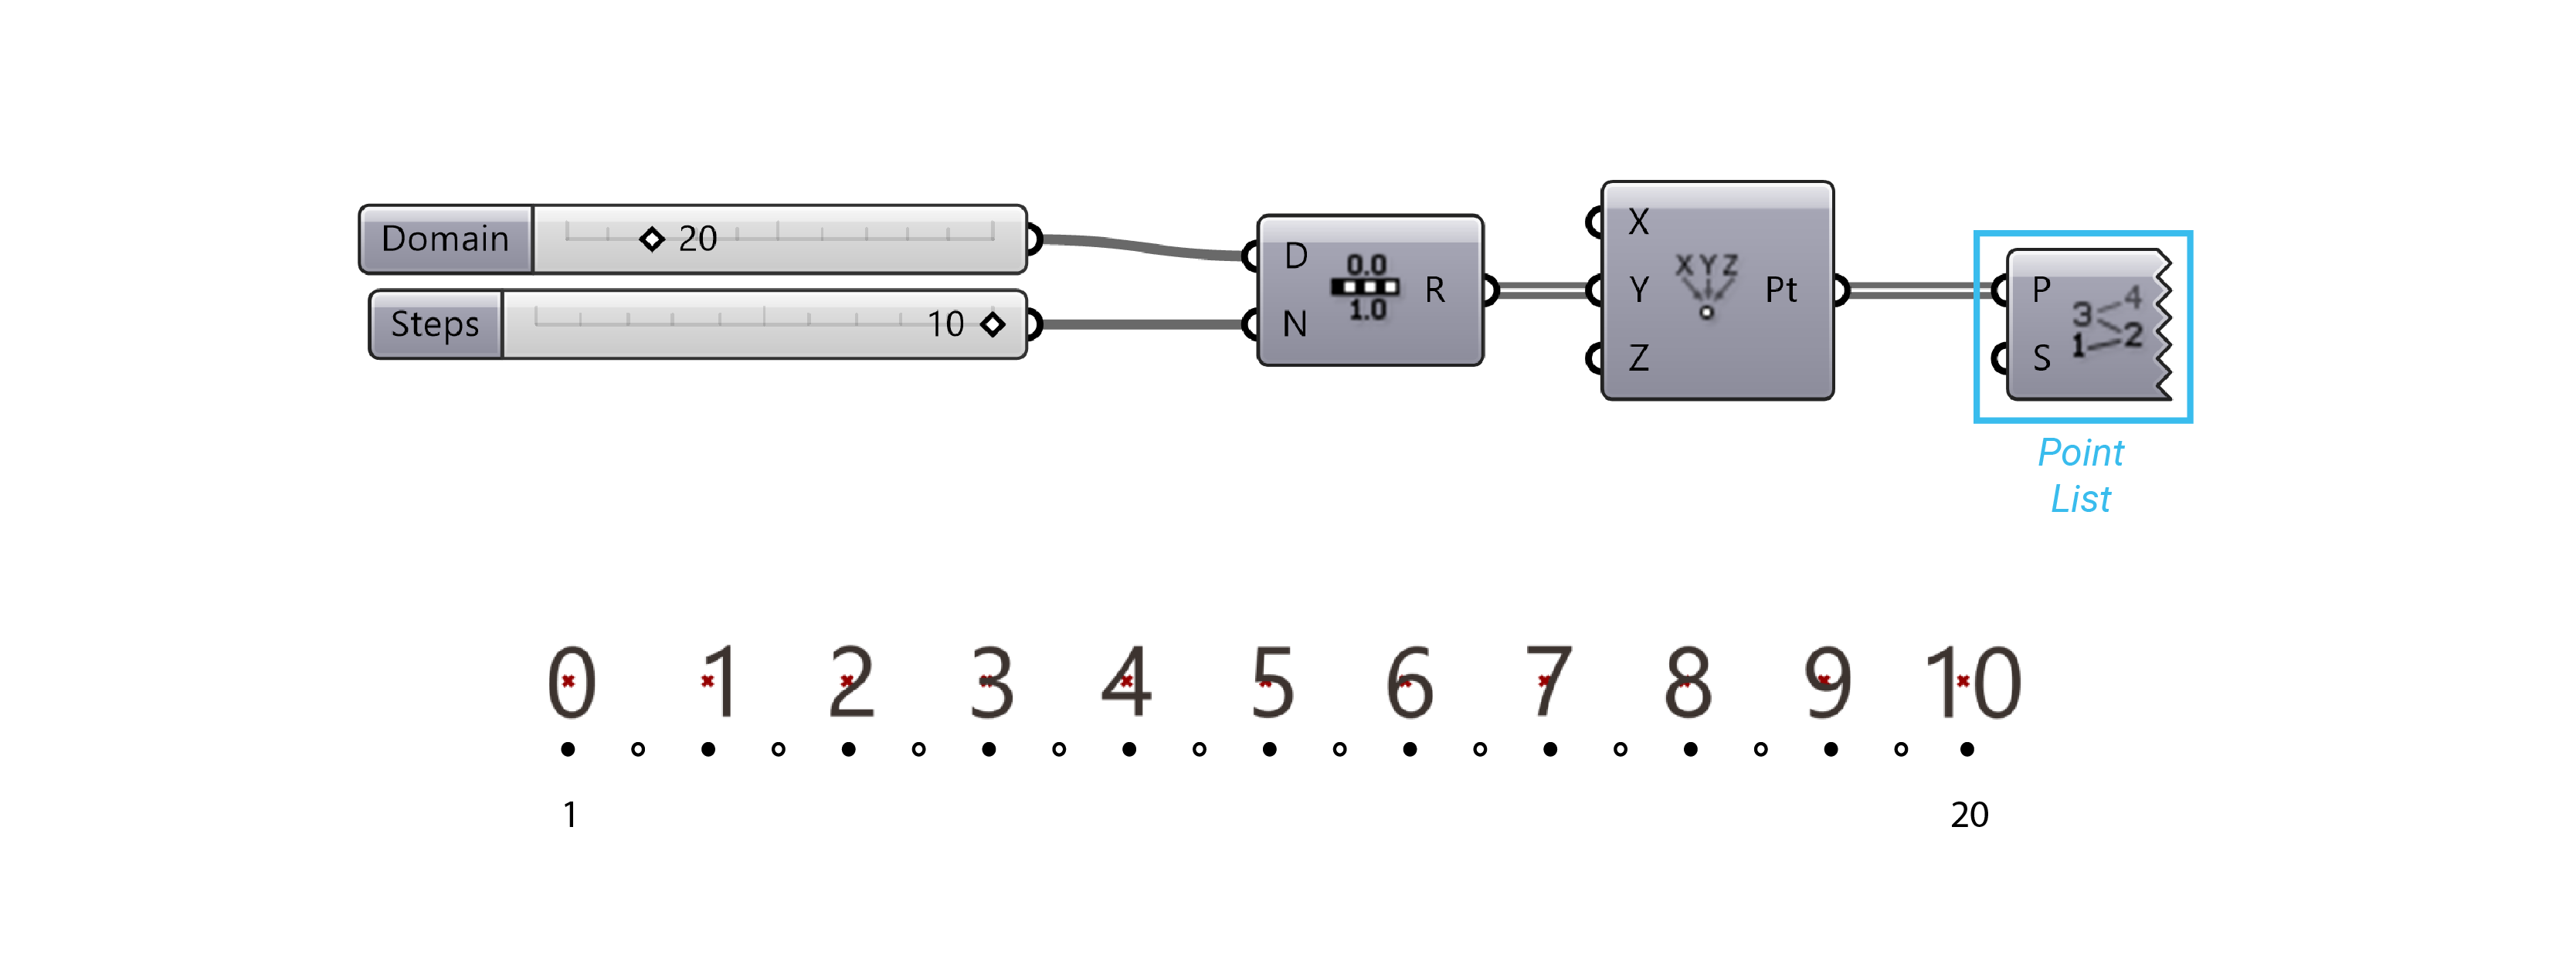
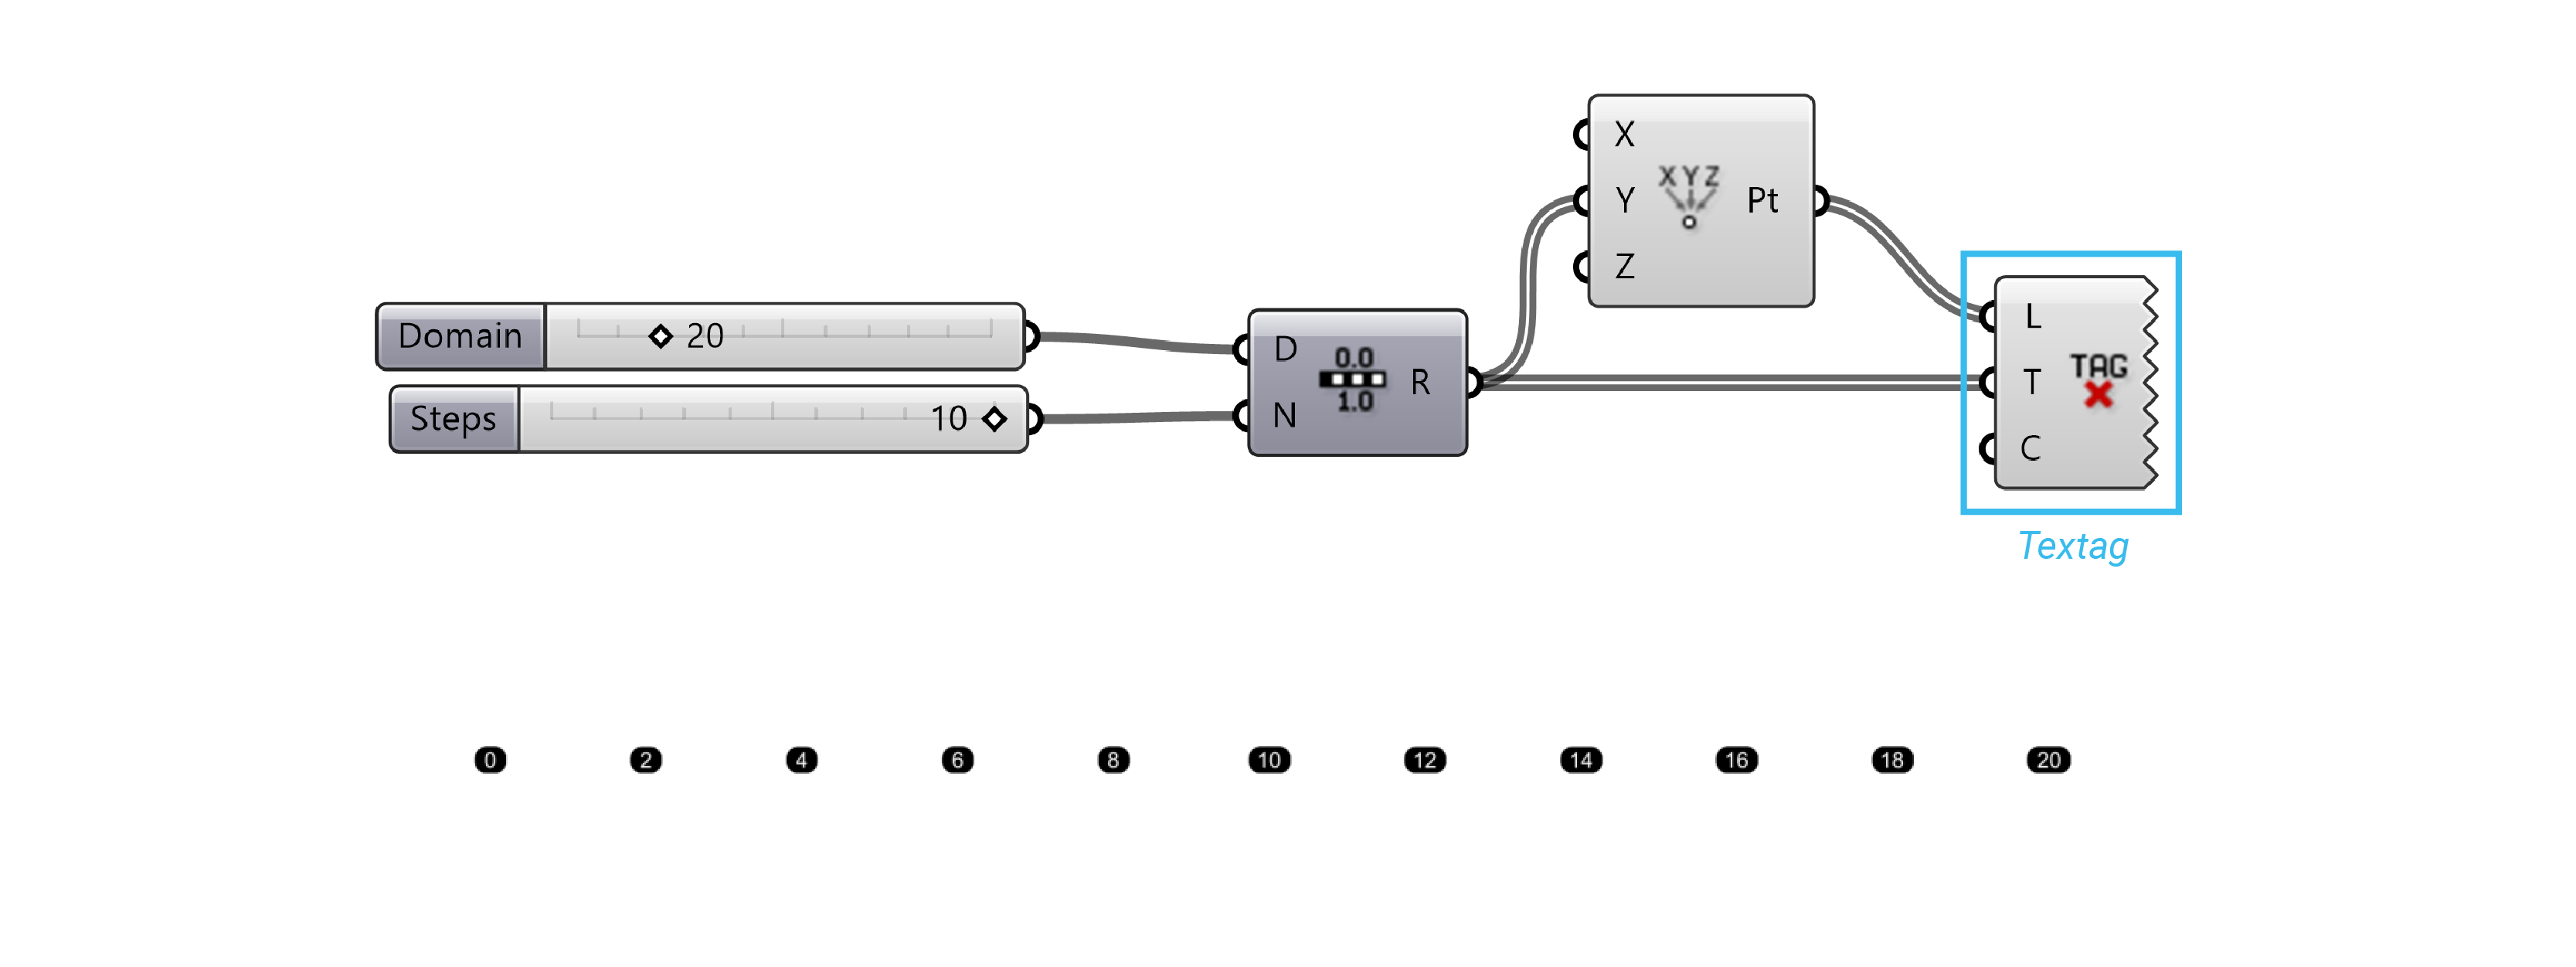
Point List
Displays the Index Item Number next to the point geometry in the viewport.
Text Tag
Draws strings as feedback items. When text tags are baked into the scene, they turn into Text Dots.
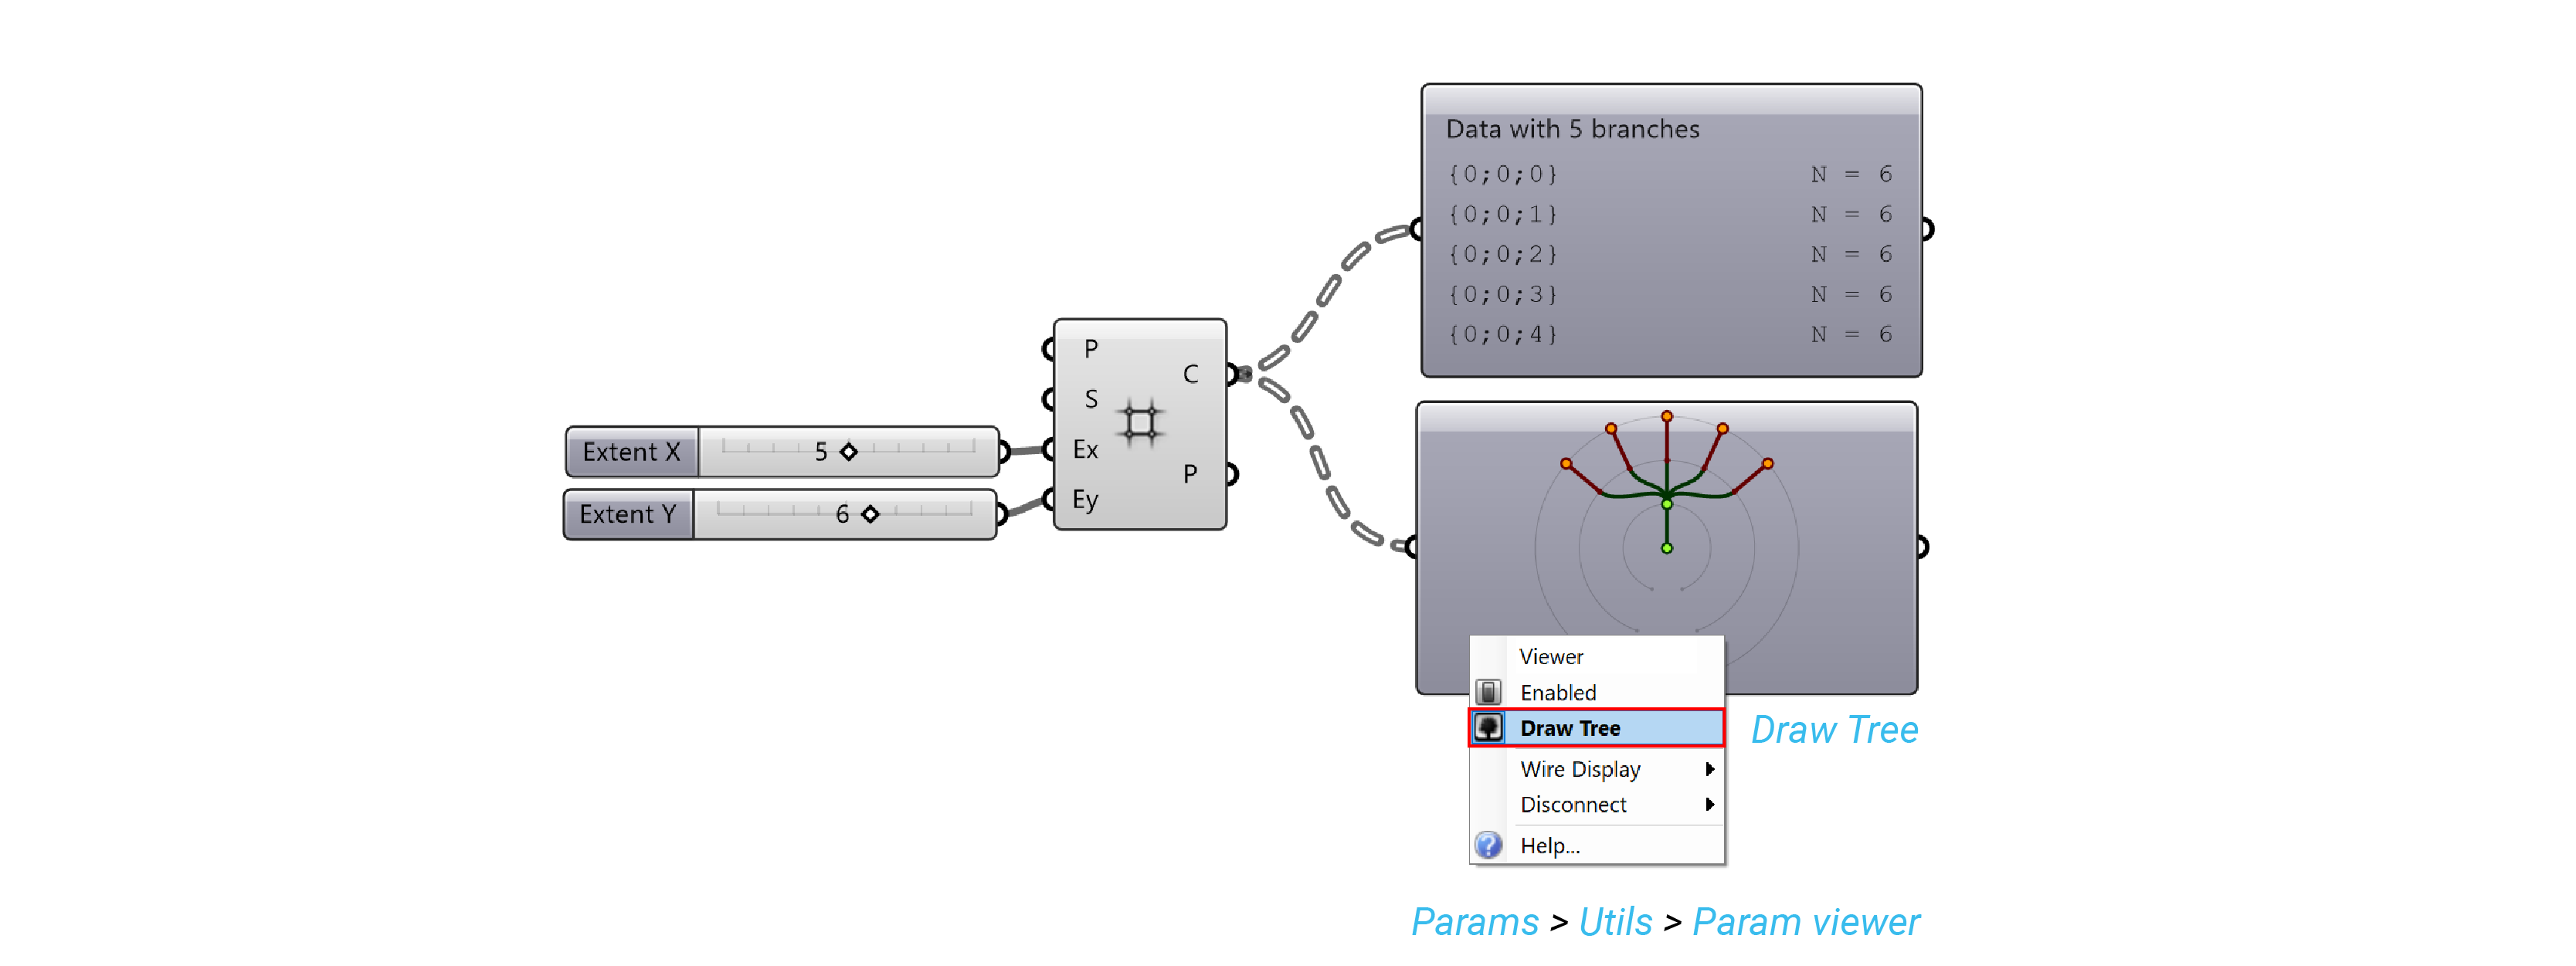
Tree visualization
Params > Util > Param Viewer
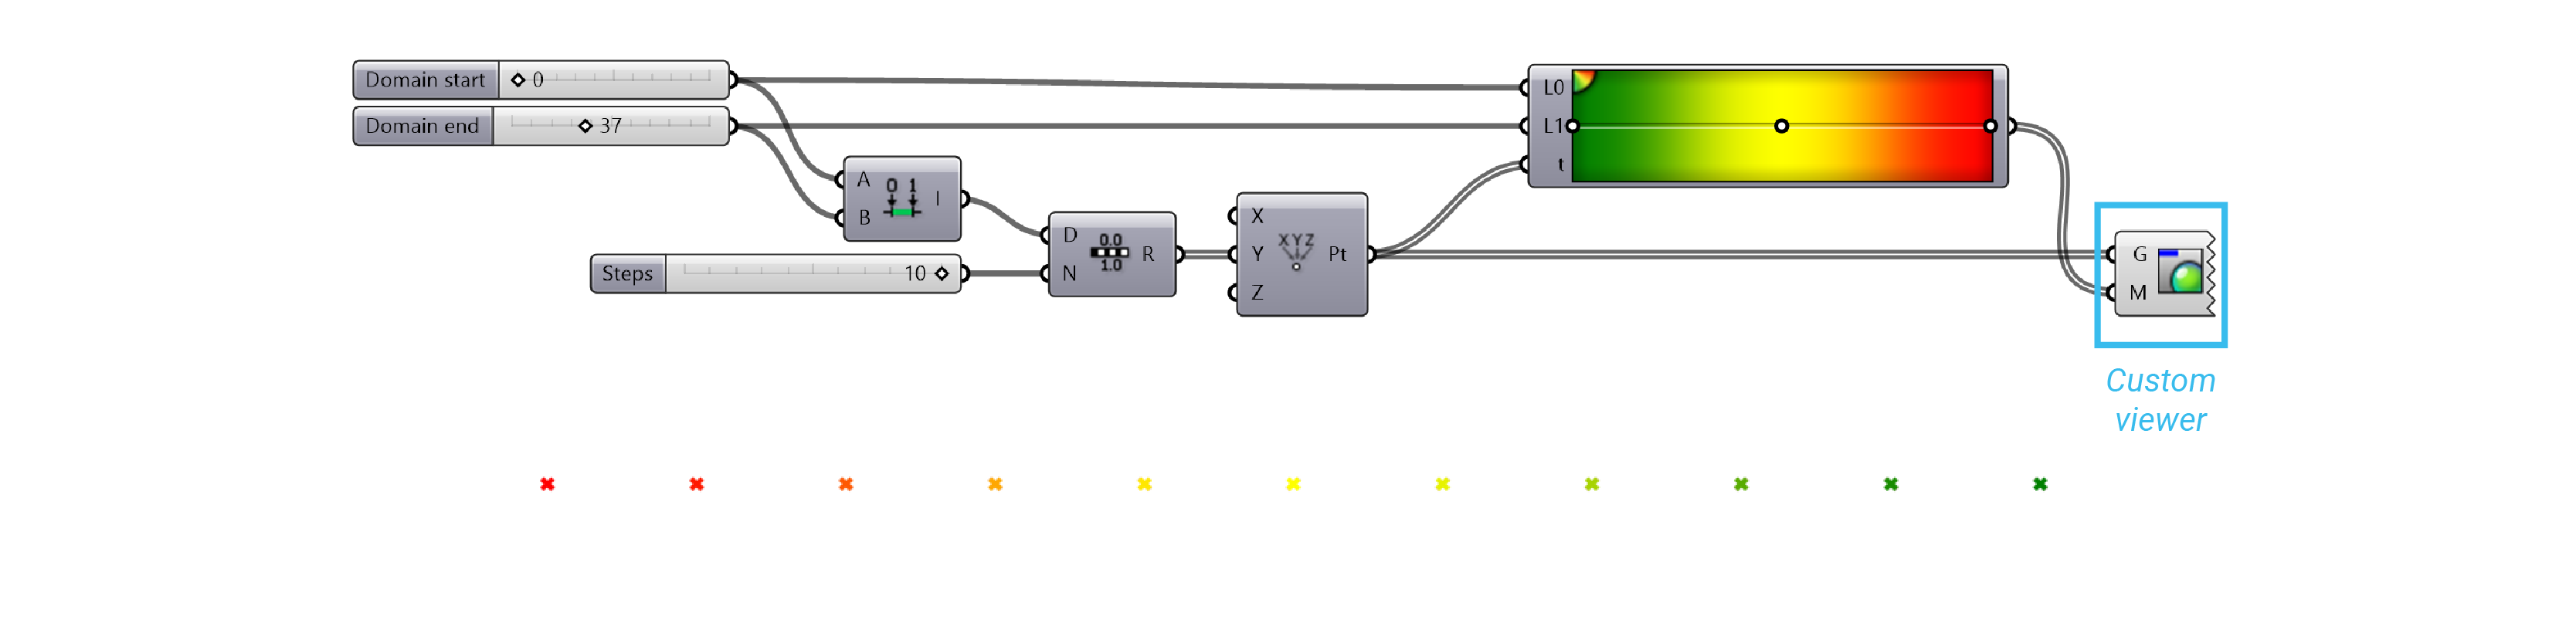
Color
We can visualize the data of a list by assigning color to it. You can find it on Params > Input > Gradient.
The L0 value represents the low end (left side) of the gradient, whereas the L1 value represents the upper end (right side). These values correspond to the Start and End of our domain. The t-values are the elements in the list that will get mapped somewhere within the L0 and L1 range.
The output of the gradient is a list of RGB color values which correspond to each point in our list.